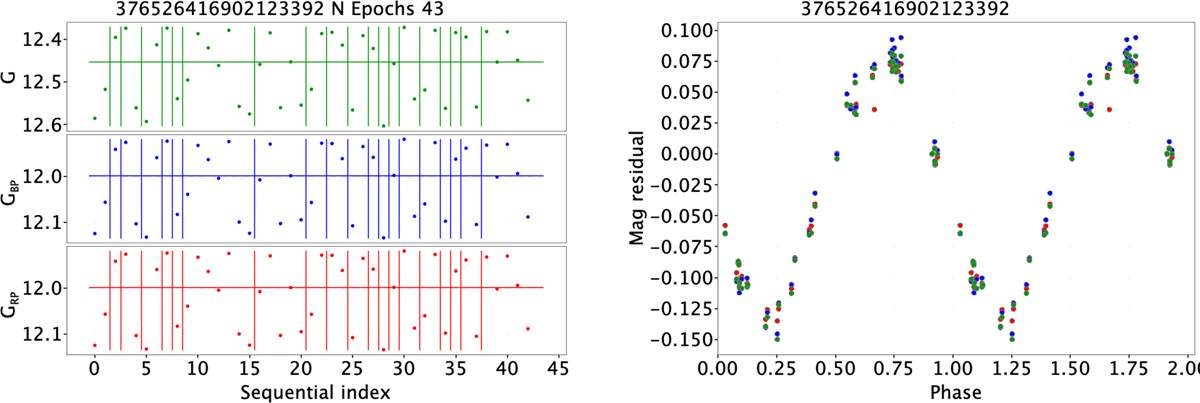
Fig. 18.
Download original image
Example of a variable identified using correlations between the three passbands. The photometry shown in the left plot is simply sorted according to time. The vertical lines indicate a time gap of more than 0.5 day between two successive observations. The horizontal line is the median value. This is more useful than displaying purely as a function of time. Due to the time sampling resulting from the scanning law of Gaia, the data points would be strongly grouped (see Fig. 10) and the correlations difficult to see. From this plot, it is clear that the photometry is correlated. The plot on the right shows a folded light curve resulting from the period found.
Current usage metrics show cumulative count of Article Views (full-text article views including HTML views, PDF and ePub downloads, according to the available data) and Abstracts Views on Vision4Press platform.
Data correspond to usage on the plateform after 2015. The current usage metrics is available 48-96 hours after online publication and is updated daily on week days.
Initial download of the metrics may take a while.