Fig. 17.
Download original image
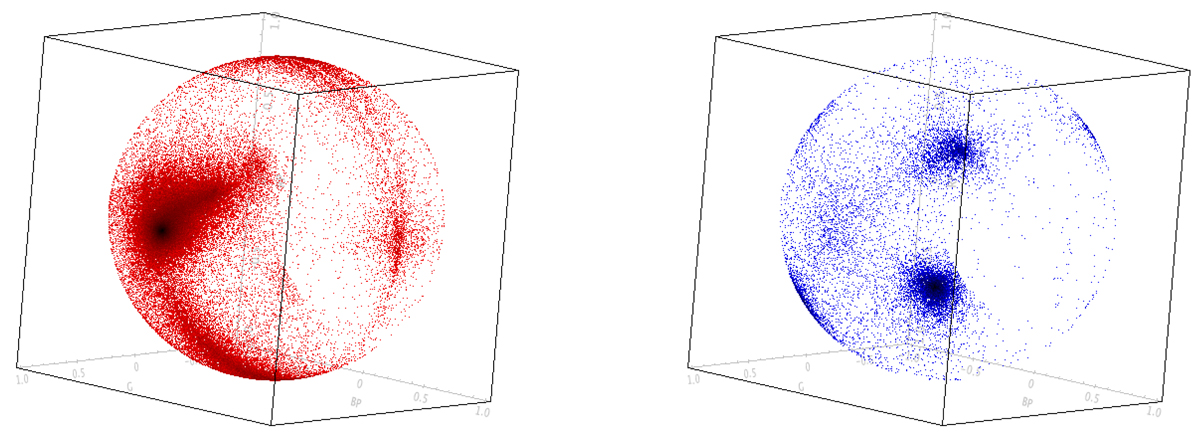
Directions of the first Eigen vector (principal component) for all the sources in GAPS with more than ten transits and R > 2.0. The left plot shows the results obtained when simply scaling the input residuals by the errors, while in the right plot, the residuals are also scaled by the measured width of the distribution. The orientation of the axes is the same in both plots.
Current usage metrics show cumulative count of Article Views (full-text article views including HTML views, PDF and ePub downloads, according to the available data) and Abstracts Views on Vision4Press platform.
Data correspond to usage on the plateform after 2015. The current usage metrics is available 48-96 hours after online publication and is updated daily on week days.
Initial download of the metrics may take a while.