Fig. 12.
Download original image
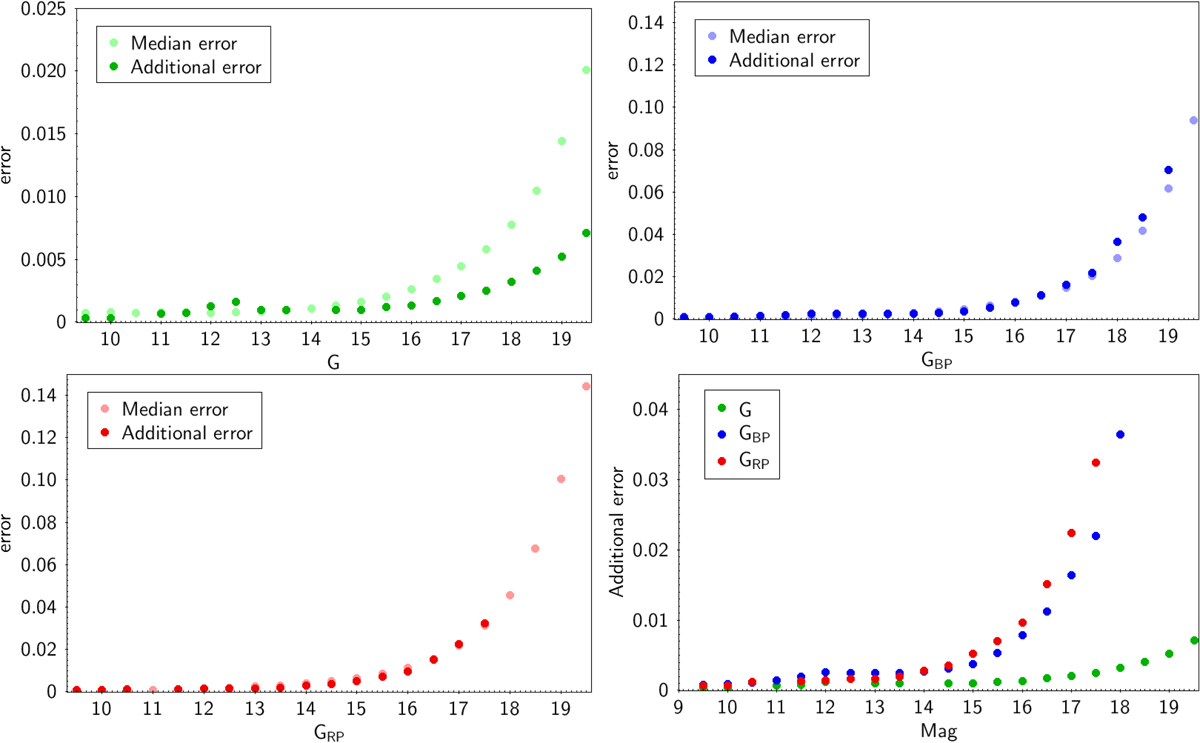
First three plots show the results for the error renormalisation analysis for G, GBP, and GRP respectively. The errors are all in magnitudes. In these plots, the median quoted error is shown along with the additional error from this analysis. We note that the BP and RP plots have a larger ordinate axis maximum. The final plot shows the additional error for all three passbands at the same time to aid comparison. Missing points indicate where the algorithm has failed.
Current usage metrics show cumulative count of Article Views (full-text article views including HTML views, PDF and ePub downloads, according to the available data) and Abstracts Views on Vision4Press platform.
Data correspond to usage on the plateform after 2015. The current usage metrics is available 48-96 hours after online publication and is updated daily on week days.
Initial download of the metrics may take a while.