Fig. 11.
Download original image
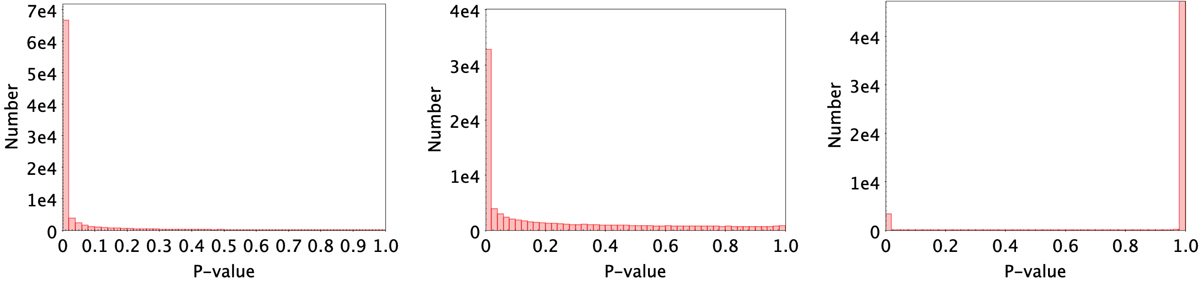
G band P-value distributions for sources in the range 16 < G < 17 for three cases in which the following magnitude errors were added in quadrature to the errors provided in the archive: 0.0 (left panel), 0.0019 (central panel), 0.01975 (right panel). The middle value corresponds to the selected additional error for this magnitude range.
Current usage metrics show cumulative count of Article Views (full-text article views including HTML views, PDF and ePub downloads, according to the available data) and Abstracts Views on Vision4Press platform.
Data correspond to usage on the plateform after 2015. The current usage metrics is available 48-96 hours after online publication and is updated daily on week days.
Initial download of the metrics may take a while.