Open Access
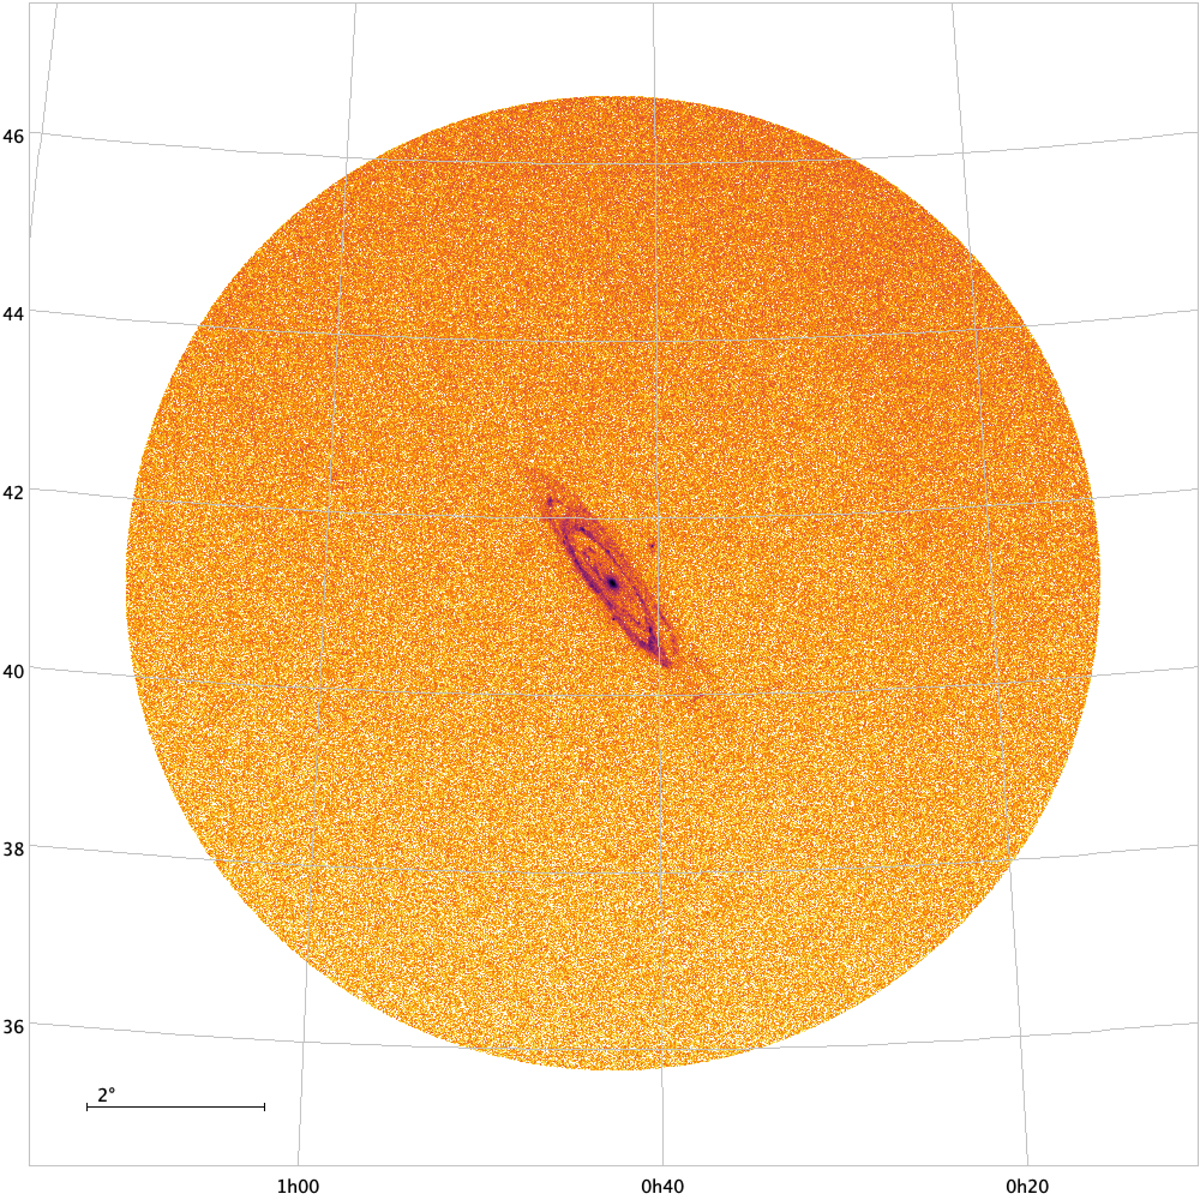
Fig. 1.
Download original image
Overall area covered by this survey in equatorial coordinates. As with many sky plots from Gaia, this is not an image but a diagram showing sources identified by Gaia. The density scale is logarithmic. Also visible are M 32 and M 110.
Current usage metrics show cumulative count of Article Views (full-text article views including HTML views, PDF and ePub downloads, according to the available data) and Abstracts Views on Vision4Press platform.
Data correspond to usage on the plateform after 2015. The current usage metrics is available 48-96 hours after online publication and is updated daily on week days.
Initial download of the metrics may take a while.