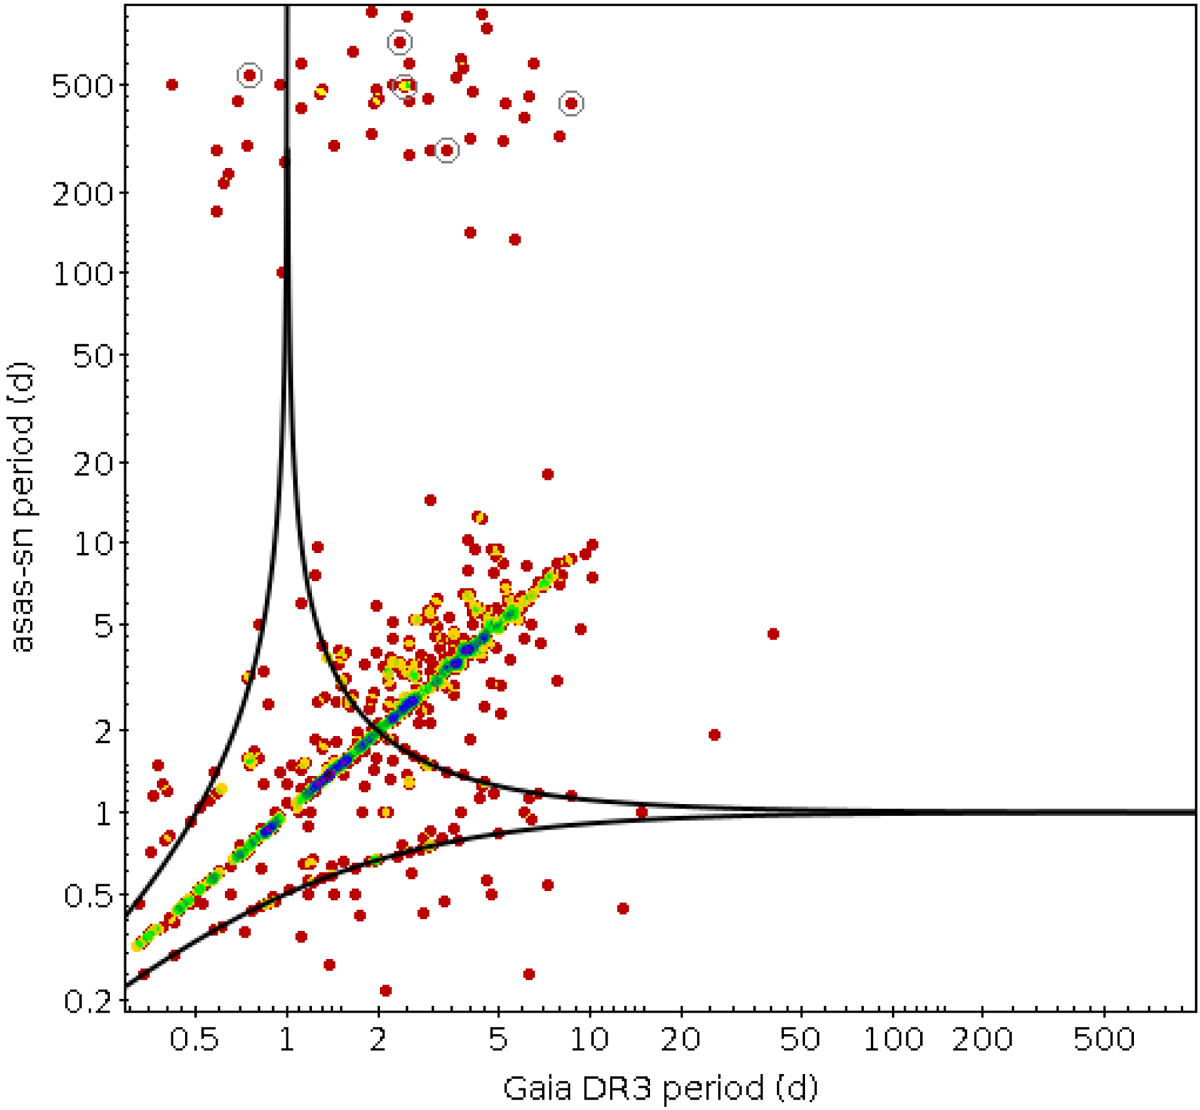
Fig. B.5.
Download original image
Comparison between the periods detected in the asas-sn survey and those in Gaia DR3. The points are colour coded according to their density. The continuous dark line depicts the loci defined by Eq. B.6 for n=1. The sources surrounded with the dark circles are also reported in Hartman et al. (2011) with periods very similar to those reported in Gaia DR3 (see Table B.3).
Current usage metrics show cumulative count of Article Views (full-text article views including HTML views, PDF and ePub downloads, according to the available data) and Abstracts Views on Vision4Press platform.
Data correspond to usage on the plateform after 2015. The current usage metrics is available 48-96 hours after online publication and is updated daily on week days.
Initial download of the metrics may take a while.