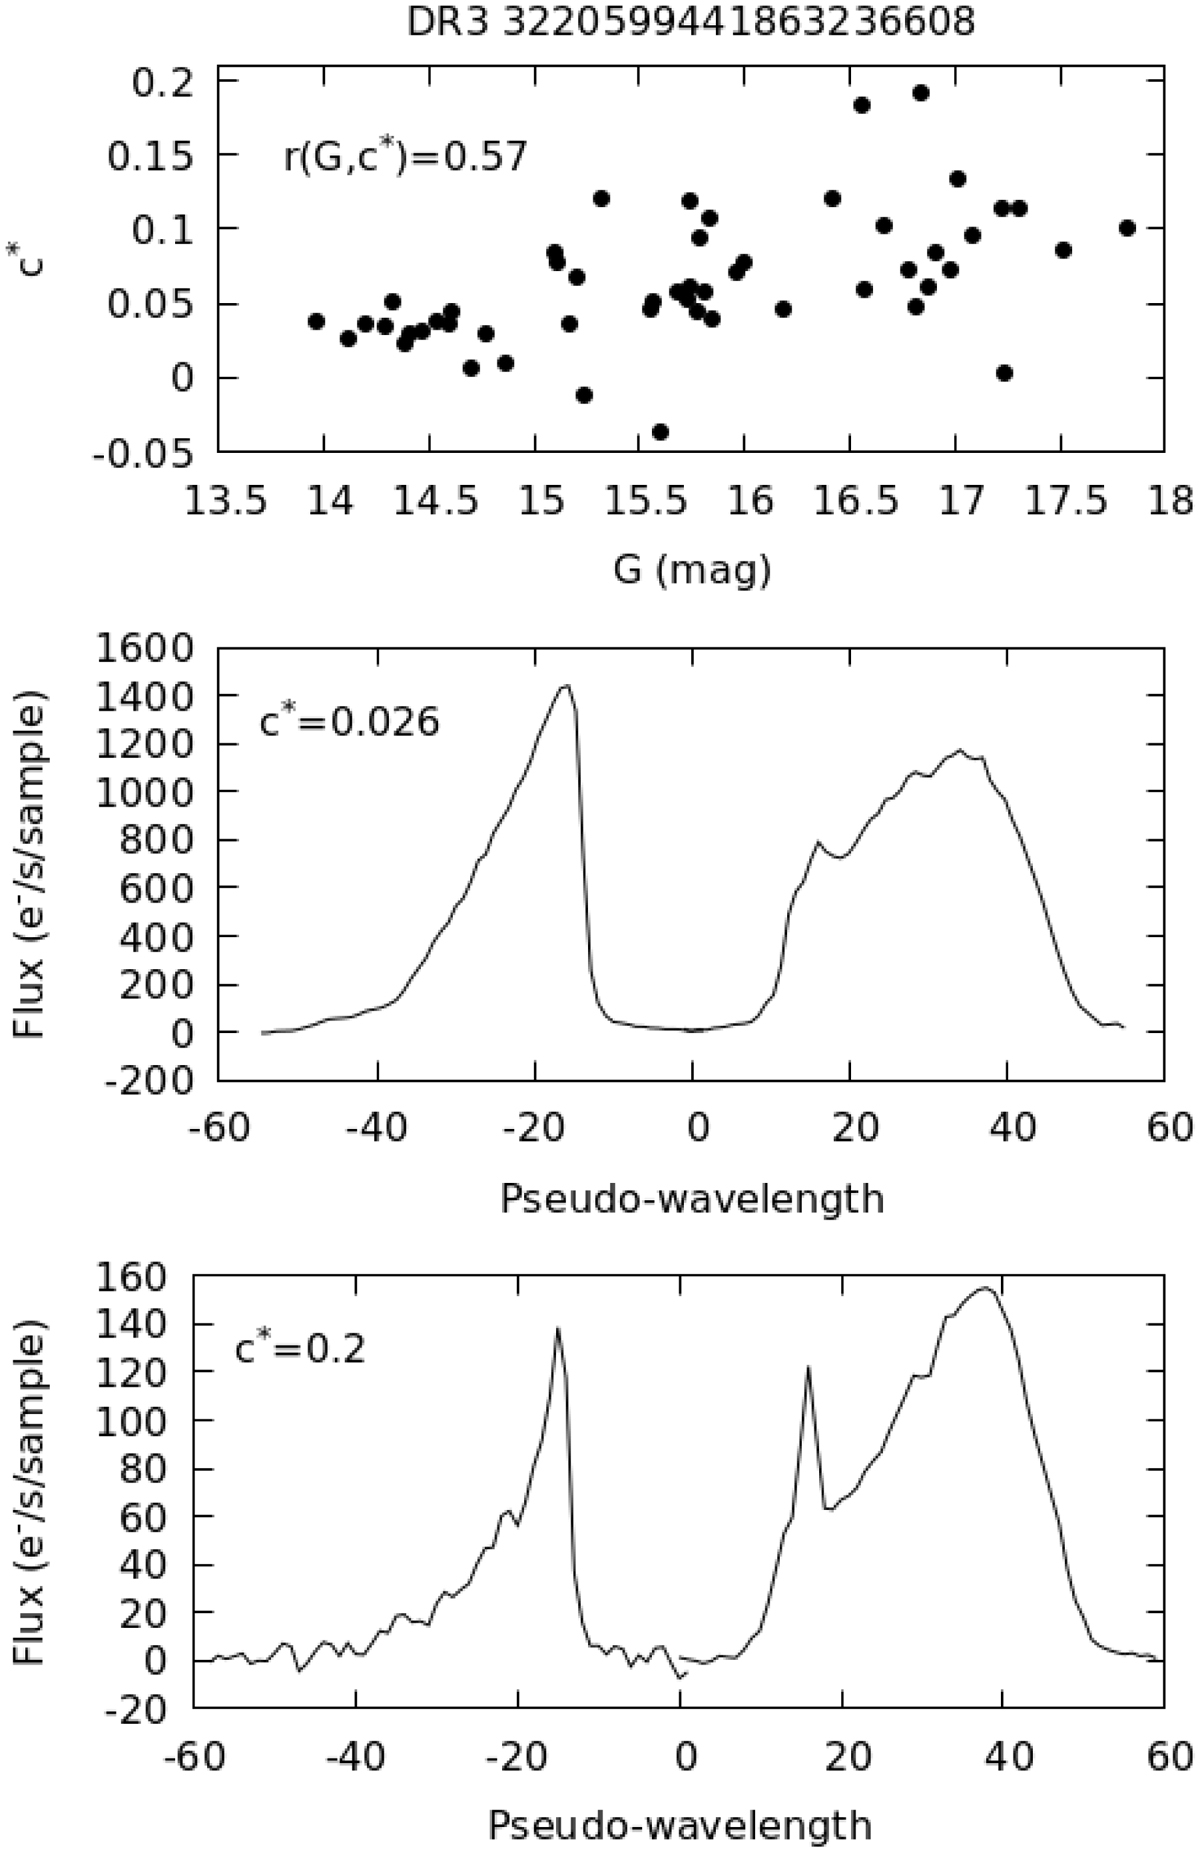
Fig. A.5.
Download original image
Example of a star with a strong emission line. Top panel: c* vs. G for the star Gaia DR3 3220599441863236608. The two quantities are moderately correlated (rexf = 0.57). Middle panel: GBP and GRP epoch spectra corresponding to c* = 0.026. Bottom panel: GBP and GRP epoch spectra corresponding to c* = 0.2. In this case the high corrected excess factor is due to a strong emission line falling in a region where the sensitivity of the G and GRP bands are different. We note that the GBP and GRP epoch spectra are only shown here for illustration; they will be available to the community in Gaia DR4.
Current usage metrics show cumulative count of Article Views (full-text article views including HTML views, PDF and ePub downloads, according to the available data) and Abstracts Views on Vision4Press platform.
Data correspond to usage on the plateform after 2015. The current usage metrics is available 48-96 hours after online publication and is updated daily on week days.
Initial download of the metrics may take a while.