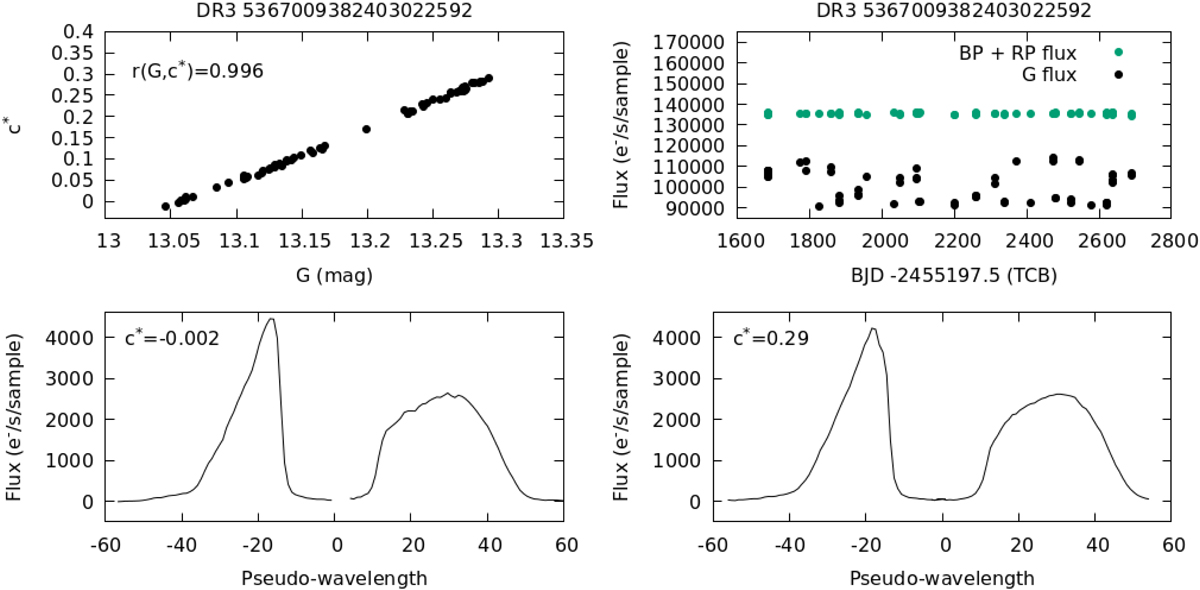
Fig. A.4.
Download original image
Example of a bad calibrated source. Top left panel: c* vs. G for the star Gaia DR3 5367009382403022592. The two quantities are strongly correlated (rexf = 0.996). Top right panel: IG (black bullets) and IGBP + IGRP (green bullets) time series. While IGBP + IGRP is almost constant vs. time, the IG time series exhibits temporal variations with a peak-to-peak amplitude of about 20%. This variability is very likely due to instrumental issues, otherwise it should be visible also in the IGBP + IGRP time series. Bottom left panel: GBP and GRP epoch spectra corresponding to c* = 0.002. Bottom right panel:GBP and GRP epoch spectra corresponding to c* = 0.29. We note that the GBP and GRP epoch spectra are only shown here for illustration; they will be available to the community in Gaia DR4.
Current usage metrics show cumulative count of Article Views (full-text article views including HTML views, PDF and ePub downloads, according to the available data) and Abstracts Views on Vision4Press platform.
Data correspond to usage on the plateform after 2015. The current usage metrics is available 48-96 hours after online publication and is updated daily on week days.
Initial download of the metrics may take a while.