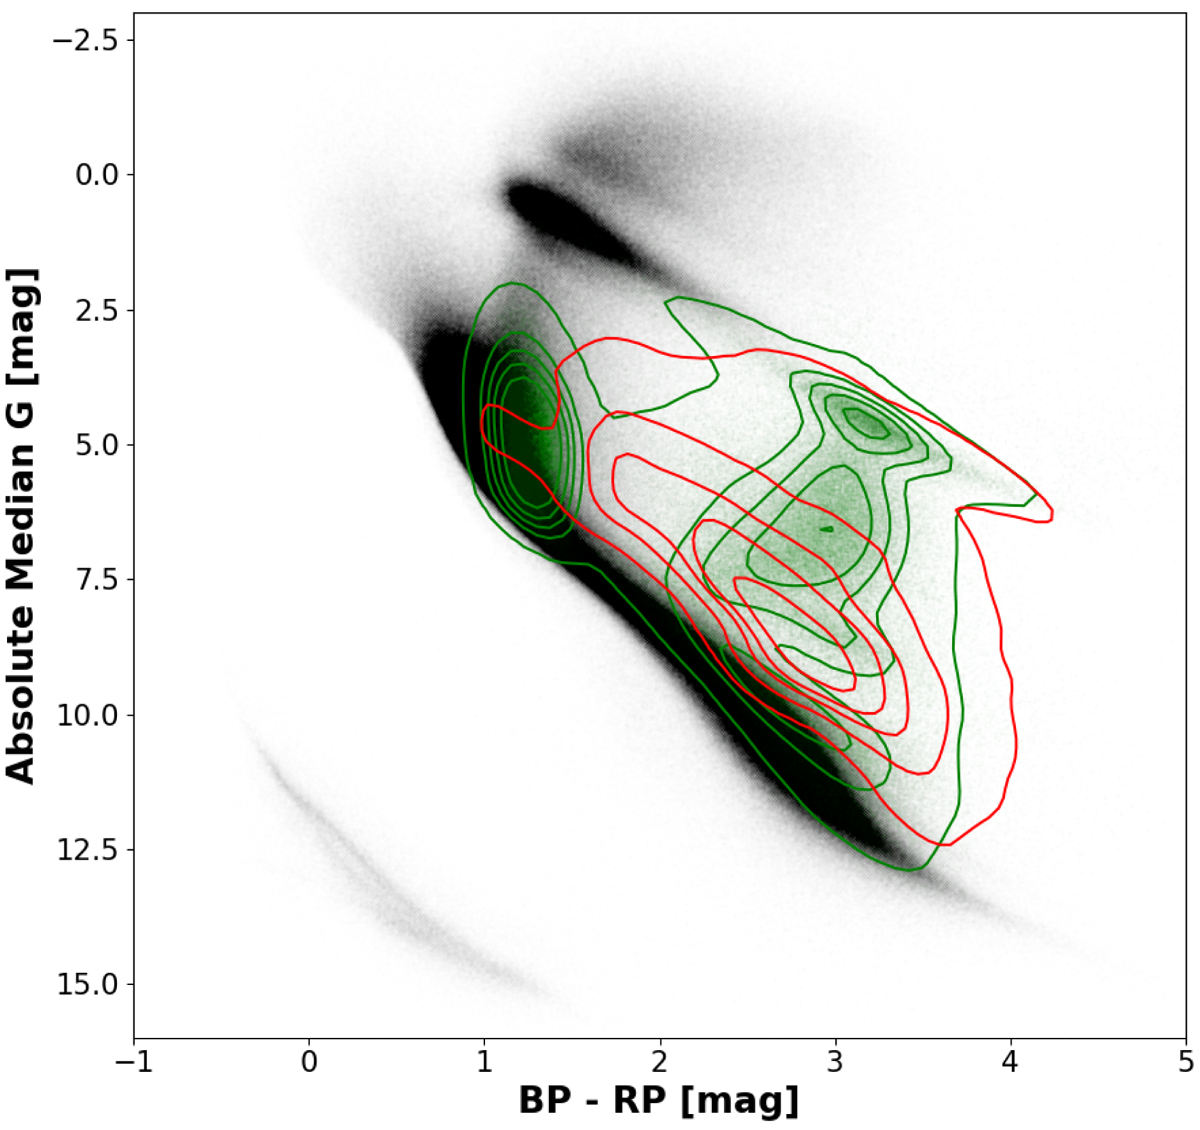
Fig. 7.
Download original image
Same as Fig. 4 but for the Gaia DR3 (red contours) and M19 YSO candidates with R ≥ 0.5 and LY ≥ 0.95, or R < 0.5 and SY ≥ 0.95 (green dots and contours). The probability distributions are shown in Figs. B.4 and B.8. The main parameters of the distributions are listed in Table 1. Because the Gaia DR3 YSO distribution is narrower, for better visibility we plotted them on the top of the M19 distribution.
Current usage metrics show cumulative count of Article Views (full-text article views including HTML views, PDF and ePub downloads, according to the available data) and Abstracts Views on Vision4Press platform.
Data correspond to usage on the plateform after 2015. The current usage metrics is available 48-96 hours after online publication and is updated daily on week days.
Initial download of the metrics may take a while.