Fig. 5.
Download original image
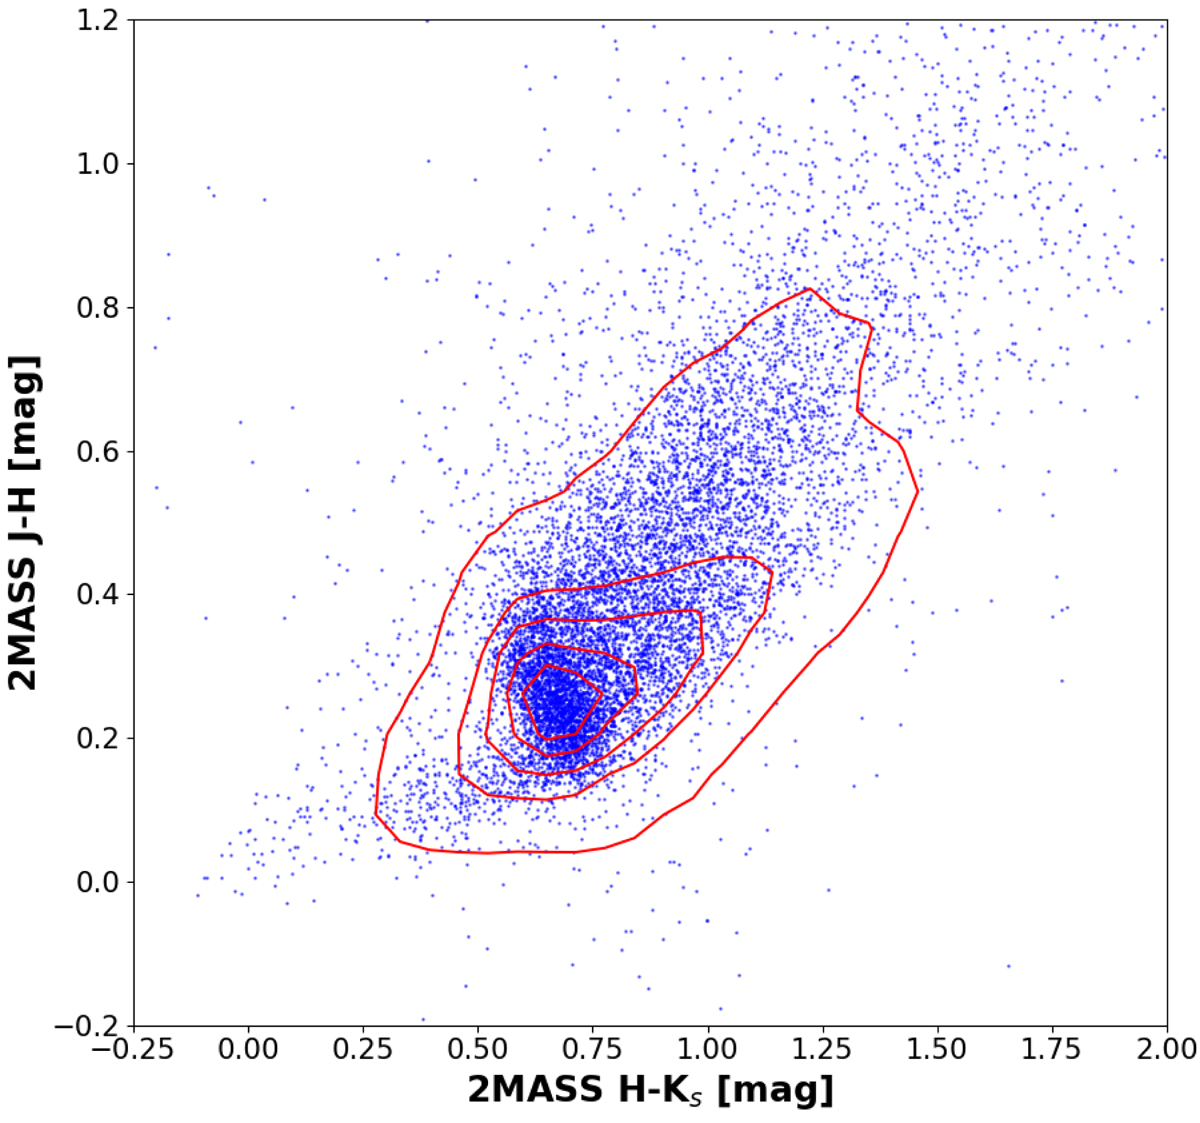
KYSO sources (blue dots) and Gaia DR3 YSOs (red contours) on the 2MASS colour–colour diagram. The median, mean, standard deviation, and 5% and 95% quantiles of both colours are listed in Table 1. The colour probability distributions are shown in Figs. B.9 and B.13. The main parameters of the distributions are listed in Table 1.
Current usage metrics show cumulative count of Article Views (full-text article views including HTML views, PDF and ePub downloads, according to the available data) and Abstracts Views on Vision4Press platform.
Data correspond to usage on the plateform after 2015. The current usage metrics is available 48-96 hours after online publication and is updated daily on week days.
Initial download of the metrics may take a while.