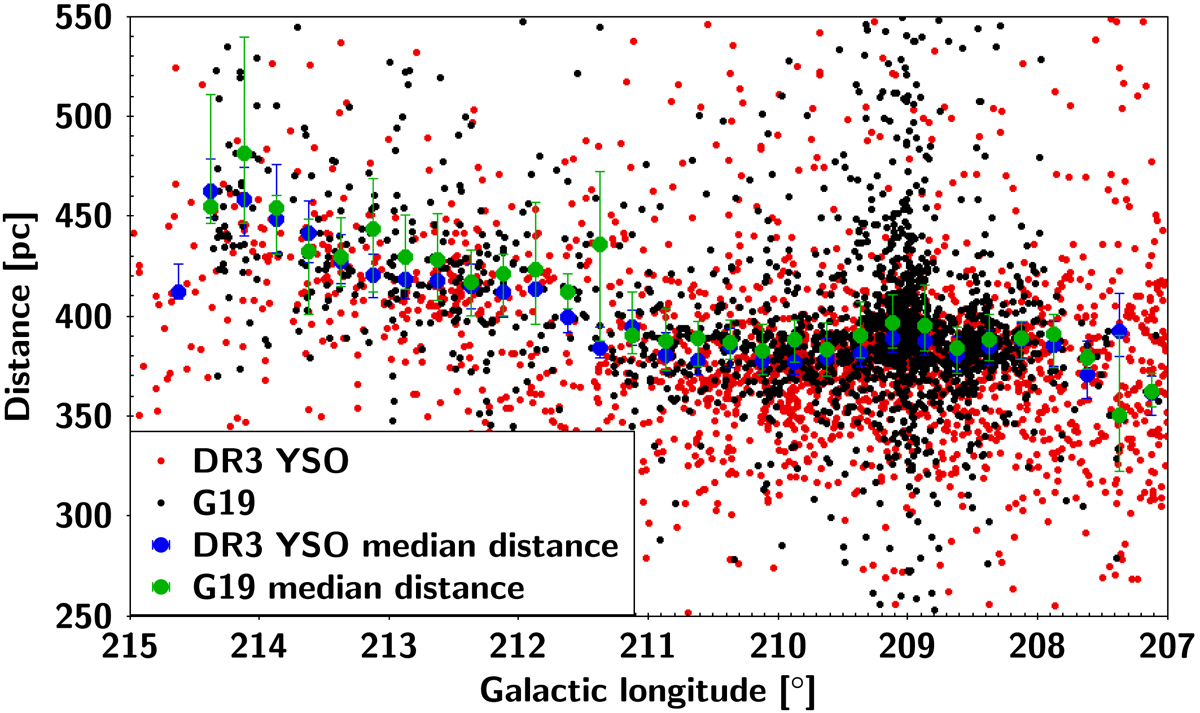
Fig. 13.
Download original image
Distance of the Gaia DR3 YSO candidates (red dots) and the Großschedl et al. (2018) YSOs (black dots) as a function of Galactic longitude. Large dots represent the med(D), which is median of the individual distance values in 0.25° bins, while error bars represent the med(D − DL) and med(D − DU), where DL and DU are the lower and upper limits of the individual distance values of the Gaia DR3 YSO candidates (blue dots) and of the Großschedl et al. (2018) YSOs (green dots).
Current usage metrics show cumulative count of Article Views (full-text article views including HTML views, PDF and ePub downloads, according to the available data) and Abstracts Views on Vision4Press platform.
Data correspond to usage on the plateform after 2015. The current usage metrics is available 48-96 hours after online publication and is updated daily on week days.
Initial download of the metrics may take a while.