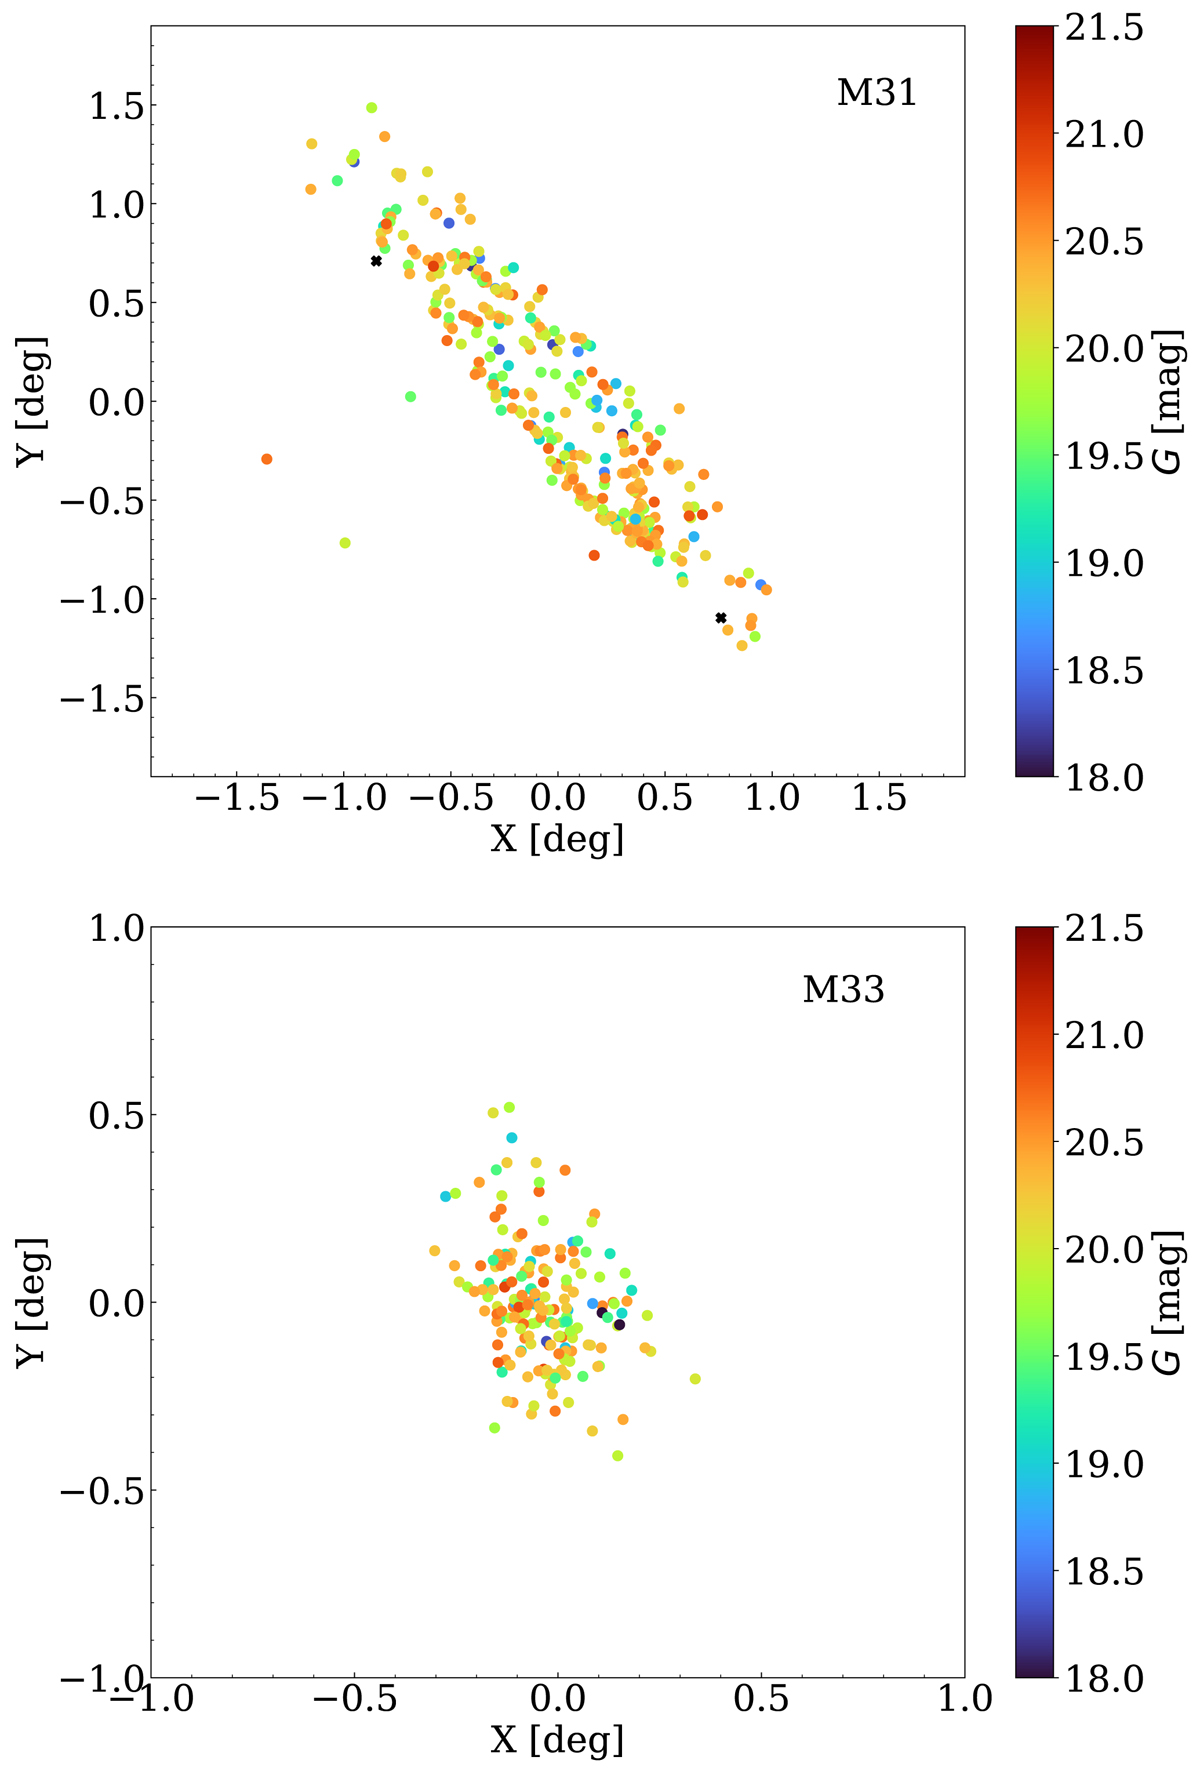
Fig. 6.
Download original image
Map of the DCEPs in M 31 (top panel) and M 33 (bottom panel). The symbols are colour coded based on the apparent G magnitude of the DCEPs. The two black crosses identify two RVTAU stars in M 31. The maps are in zenithal equidistant projection centred at equatorial coordinates (RA, Dec)M 31 = 10.6, 41.2 deg (J2000) and (RA, Dec)M 33 = 23.5, 30.65 deg (J2000).
Current usage metrics show cumulative count of Article Views (full-text article views including HTML views, PDF and ePub downloads, according to the available data) and Abstracts Views on Vision4Press platform.
Data correspond to usage on the plateform after 2015. The current usage metrics is available 48-96 hours after online publication and is updated daily on week days.
Initial download of the metrics may take a while.