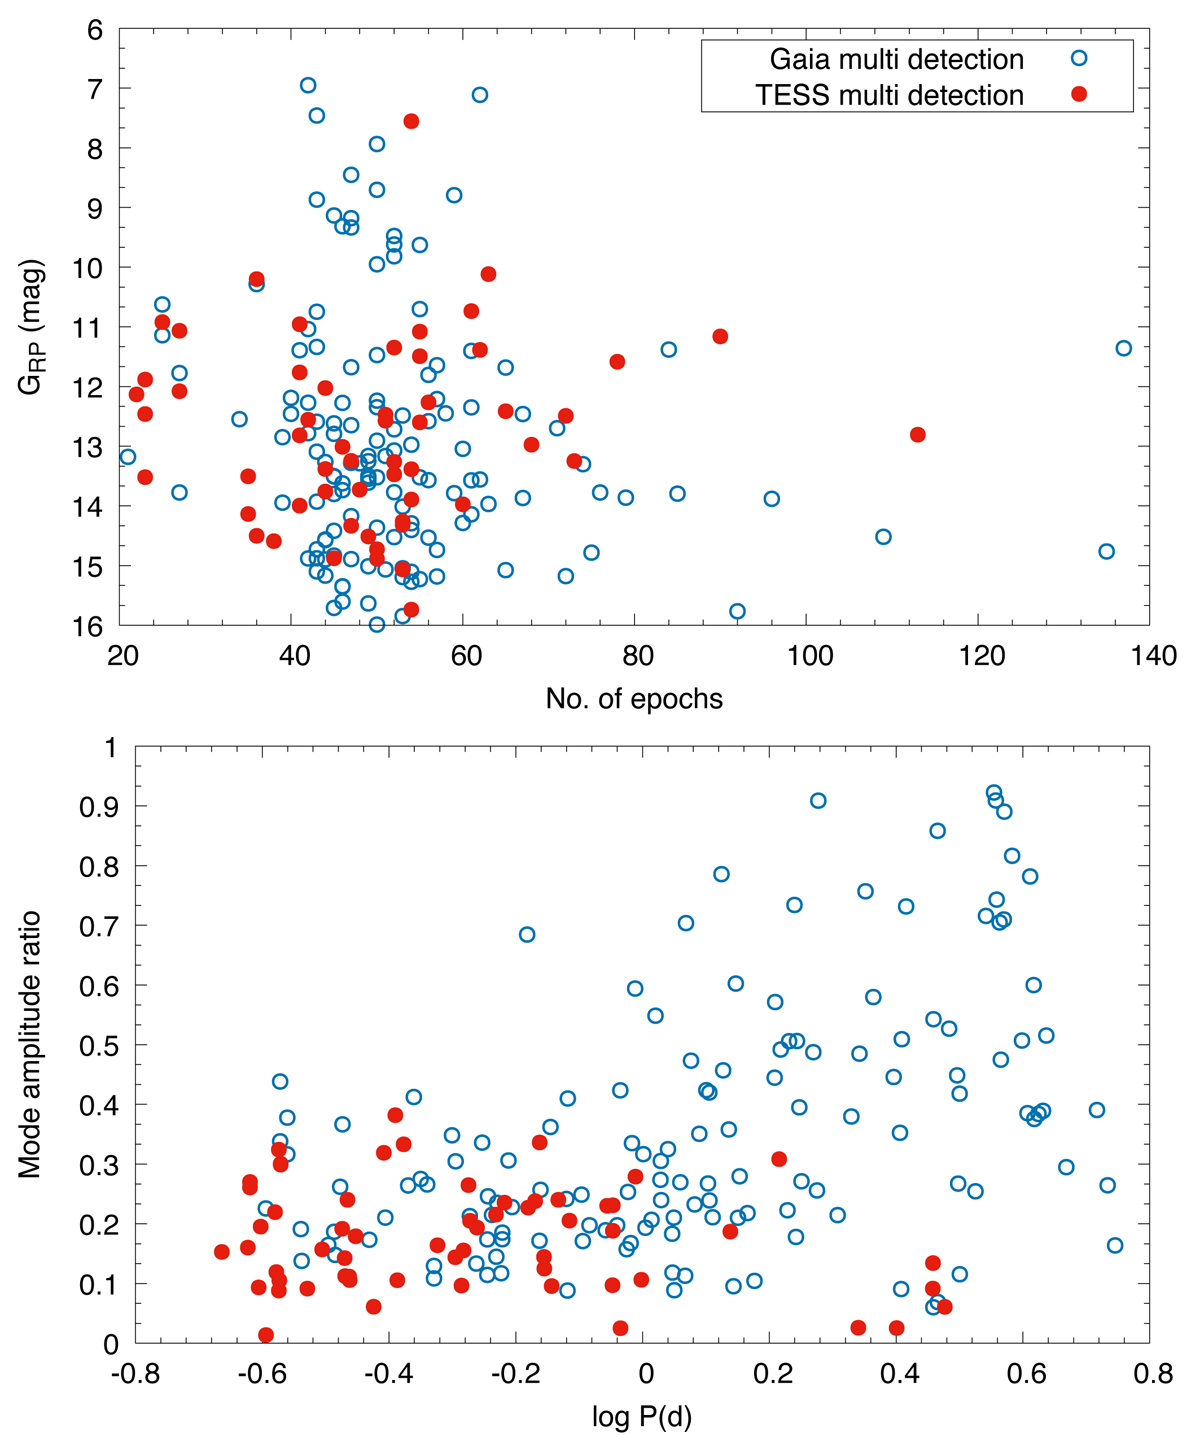
Fig. 20.
Download original image
Comparison of the parameters of the multi-mode stars detected in Gaia (blue circles) or from the TESS light curves (red dots). The upper plot compares the GRP brightness (which is close to the TESS passband) and the number of photometric epochs available in DR3. The lower plot compares the amplitude ratio of the modes and the logarithm of the longer pulsation period.
Current usage metrics show cumulative count of Article Views (full-text article views including HTML views, PDF and ePub downloads, according to the available data) and Abstracts Views on Vision4Press platform.
Data correspond to usage on the plateform after 2015. The current usage metrics is available 48-96 hours after online publication and is updated daily on week days.
Initial download of the metrics may take a while.