Fig. 1.
Download original image
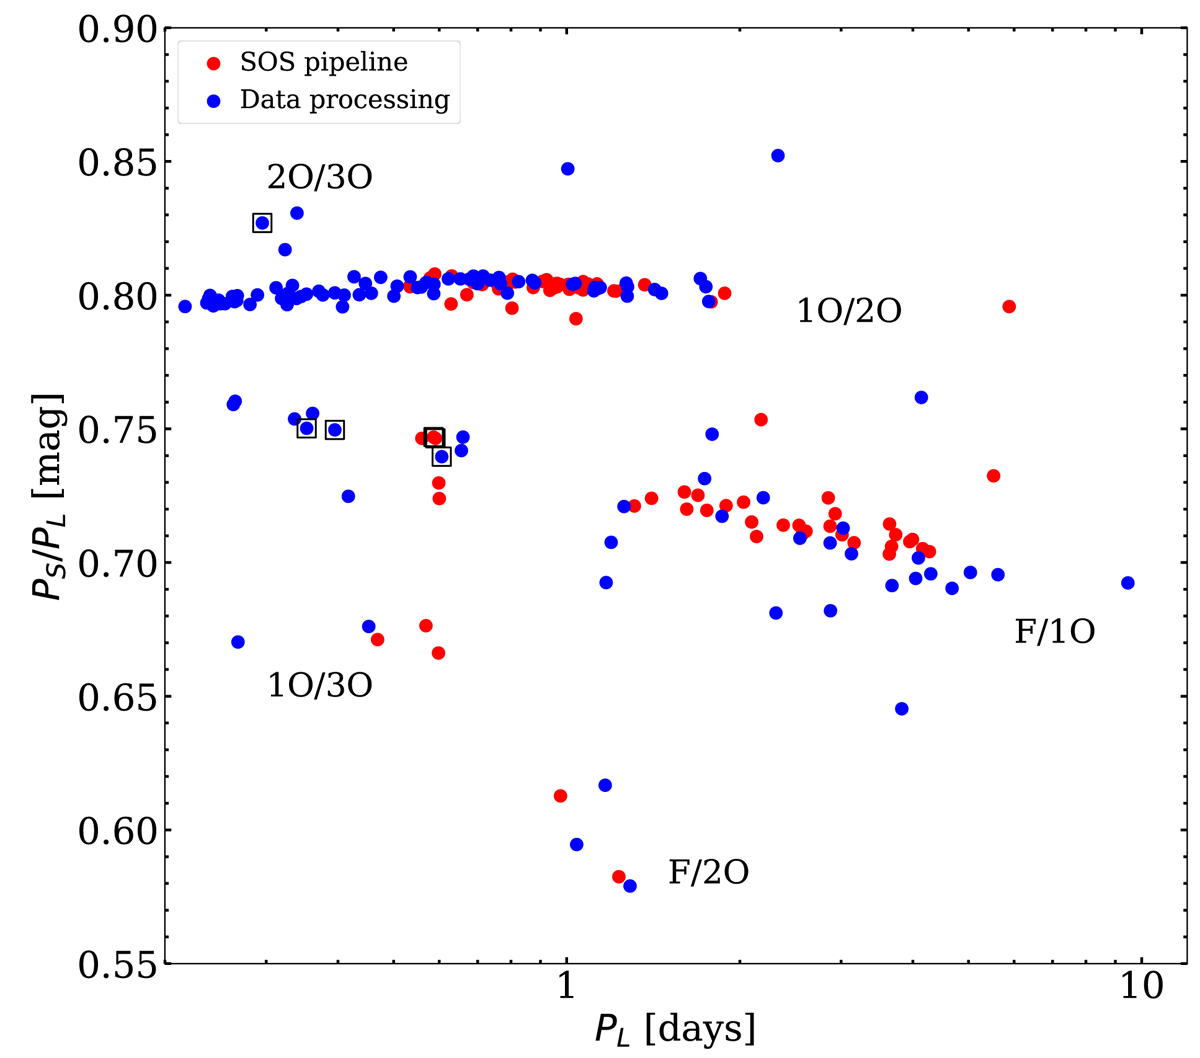
Petersen diagram for confirmed DCEP_MULTI objects published in the Gaia DR3 catalogue (red filled circles) and for additional DCEP_MULTI objects detected in the re-processing of the data (blue filled circles). PL and PS represent the longest and shortest pulsation periods of the multi-mode object. Labels show the typical location of the different multi-mode pulsation combinations identified in these sources. Black squares mark six objects known in the literature as ARRDs (see Sect. 6.4).
Current usage metrics show cumulative count of Article Views (full-text article views including HTML views, PDF and ePub downloads, according to the available data) and Abstracts Views on Vision4Press platform.
Data correspond to usage on the plateform after 2015. The current usage metrics is available 48-96 hours after online publication and is updated daily on week days.
Initial download of the metrics may take a while.