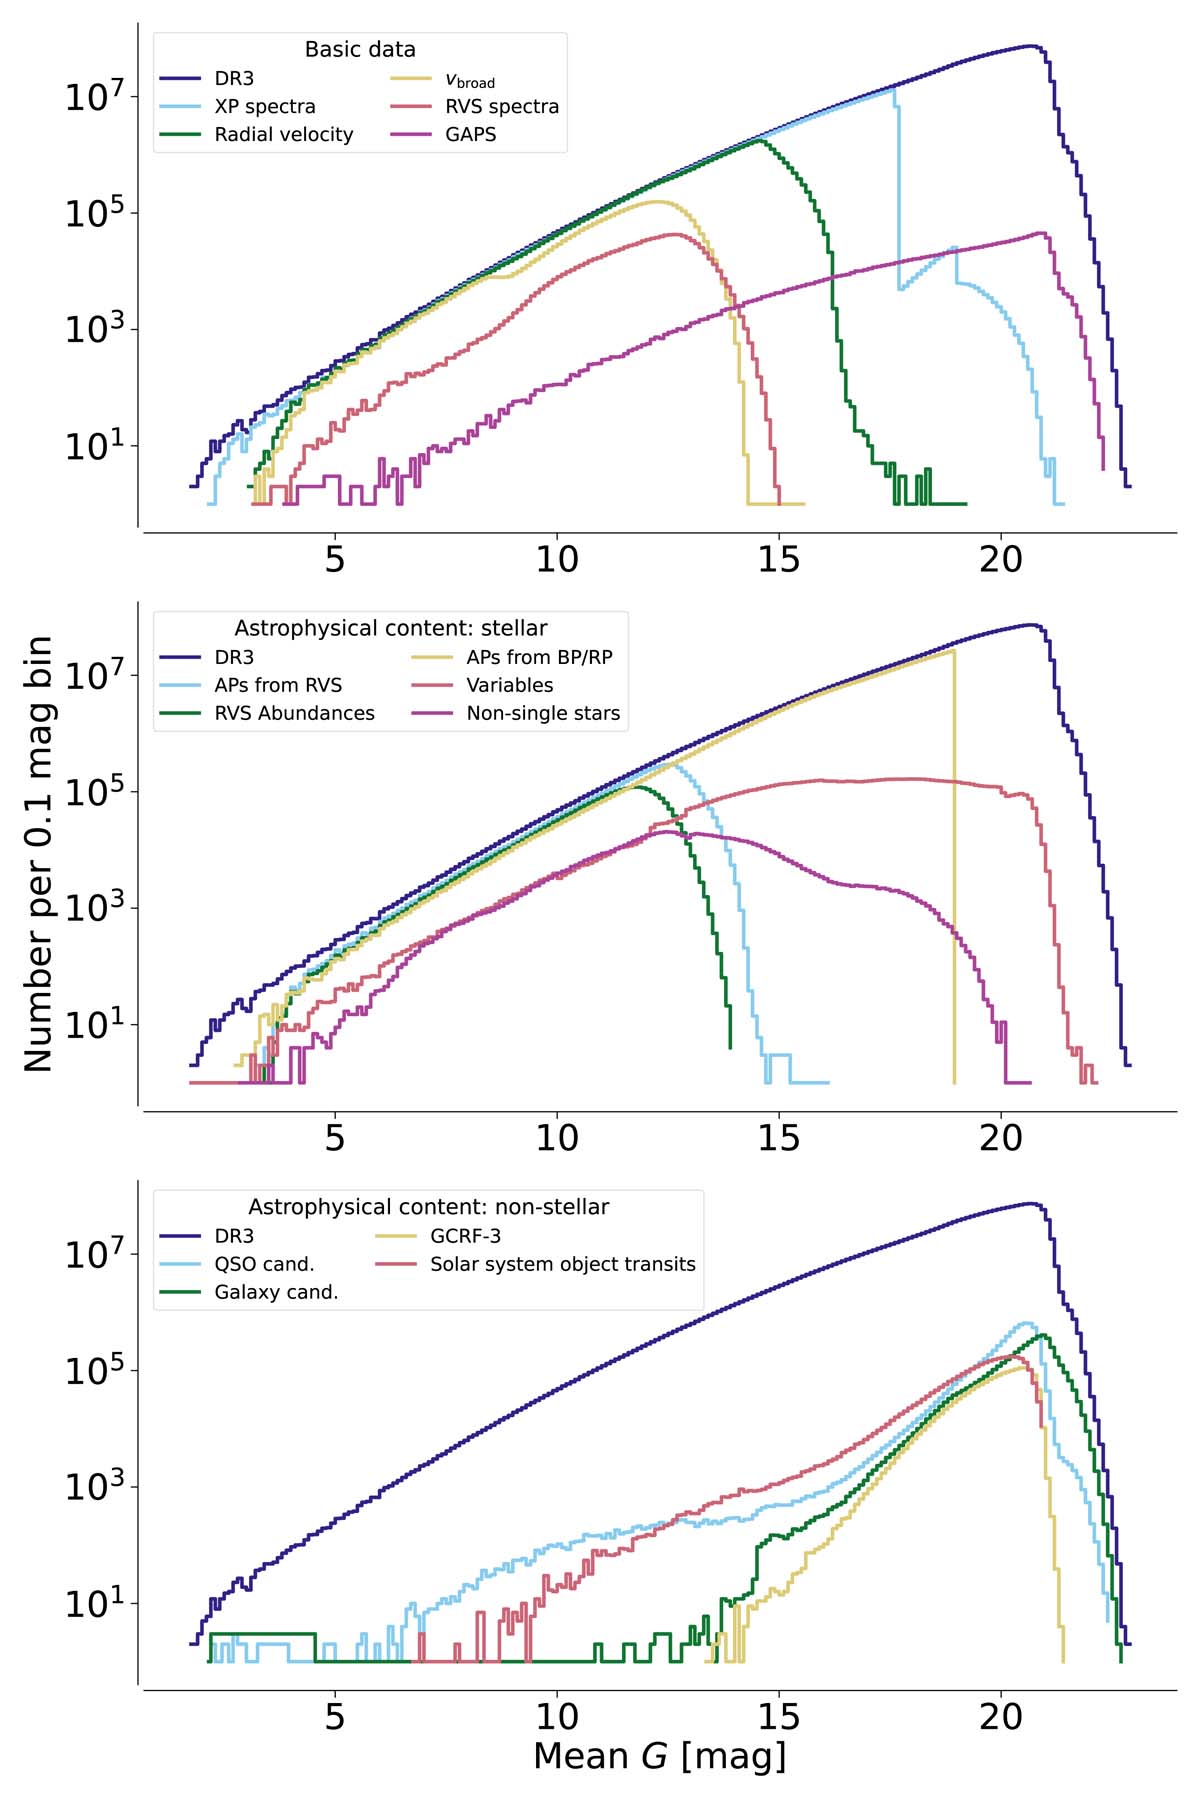
Fig. 1.
Download original image
Distribution of the mean values of G for the main Gaia DR3 components shown as histograms with bins of 0.1 mag in width. Top panel: histograms for the basic observational data in Gaia DR3 (spectra, radial velocities, vbroad, photometric time series). Middle panel: histograms for the stellar astrophysical contents, and bottom panel: non-stellar astrophysical contents. The sharp transitions in the top and middle panels at G = 17.65 and G = 19 are caused by the limit on the brightness of sources for which BP/RP spectra are published and the limit up to which astrophysical parameters were estimated. The SSO histogram shows the distribution of the transit-level G-band magnitudes (see Tanga et al. 2023, for a distribution of solar system objects in absolute magnitude H). The QSO and galaxy candidate histograms extend to very bright magnitudes which is a consequence of favouring completeness over purity in these samples, and not applying any filtering to remove them (see Gaia Collaboration 2023b).
Current usage metrics show cumulative count of Article Views (full-text article views including HTML views, PDF and ePub downloads, according to the available data) and Abstracts Views on Vision4Press platform.
Data correspond to usage on the plateform after 2015. The current usage metrics is available 48-96 hours after online publication and is updated daily on week days.
Initial download of the metrics may take a while.