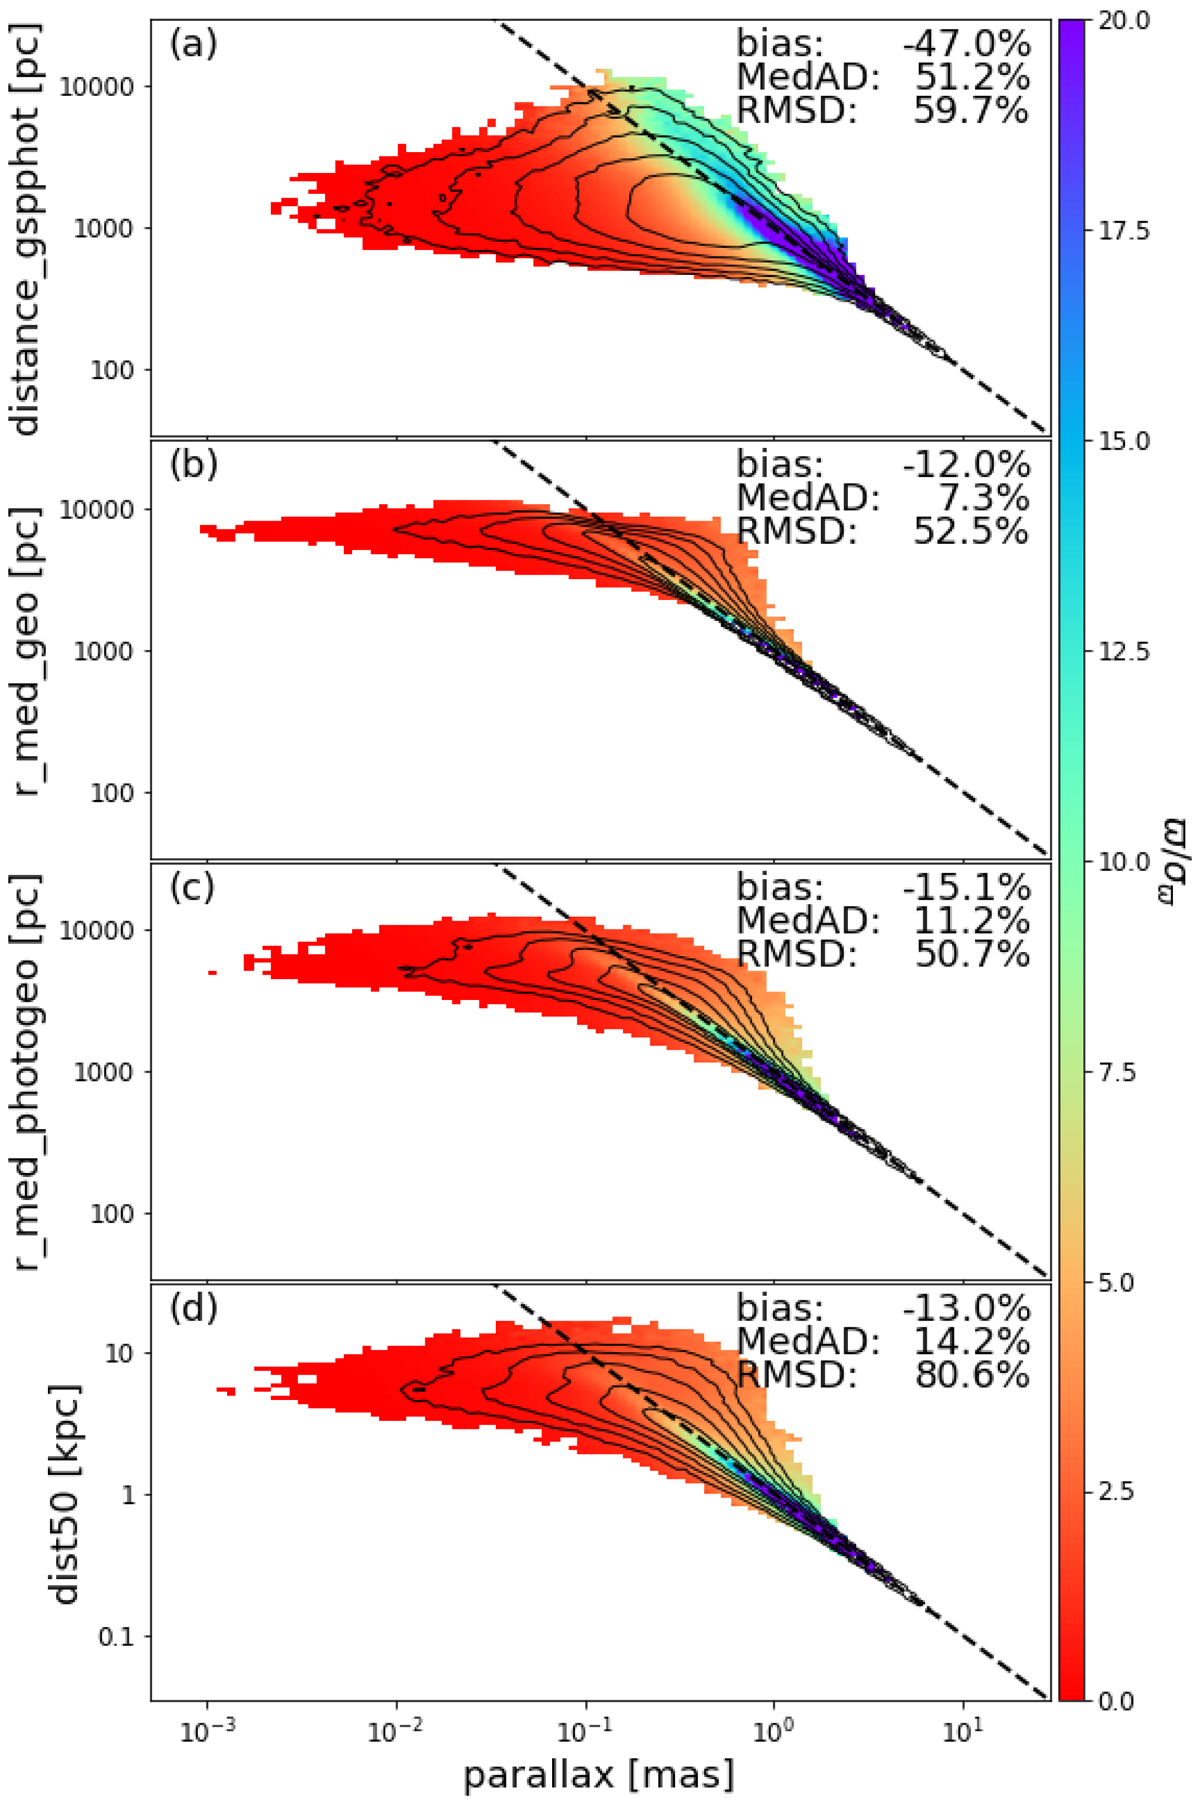
Fig. 8.
Download original image
Comparison of distances with parallaxes for a random subset of one million stars, colour-coded by parallax signal-to-noise ratio. The dashed black line indicates the expected inverse parallax-distance relation, ϖ = 1/d. Black contours indicate densities dropping by factors of 3. From top to bottom, the panels show the GSP-Phot distances from gaia_source.distance_gspphot, the geometric distances from Bailer-Jones et al. (2021), the photogeometric distances from Bailer-Jones et al. (2021), and the distances from Anders et al. (2023), respectively.
Current usage metrics show cumulative count of Article Views (full-text article views including HTML views, PDF and ePub downloads, according to the available data) and Abstracts Views on Vision4Press platform.
Data correspond to usage on the plateform after 2015. The current usage metrics is available 48-96 hours after online publication and is updated daily on week days.
Initial download of the metrics may take a while.