Fig. 39.
Download original image
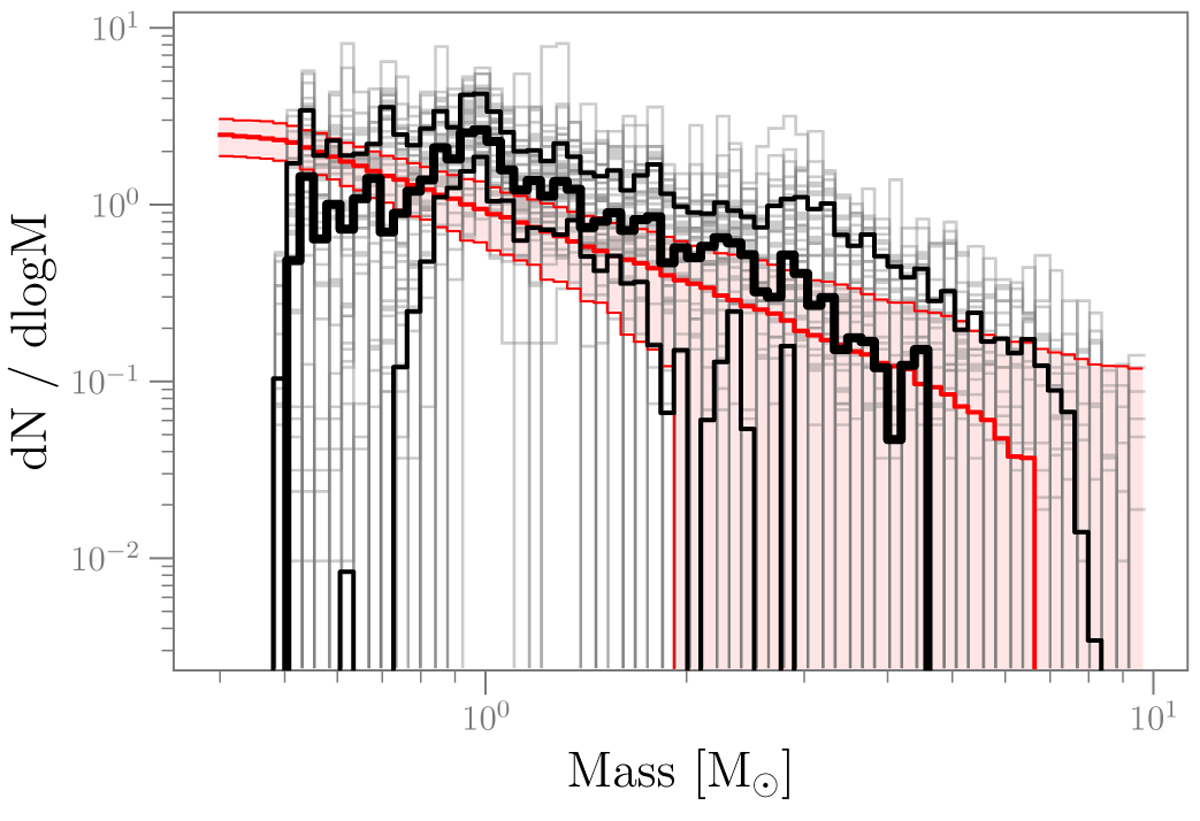
Mass distribution from FLAME compared with a Kroupa (2001) IMF. For each of the 44 open clusters from Gaia Collaboration (2018b), we plot (grey) the recovered mass distributions from FLAME estimates. We highlight the overall median and [16, 84th] percentile interval in black. For reference, we plot in red the expected shape of masses drawn from a Kroupa IMF accounting for the limited number of identified members. Because of the noise of low number-statistics, we expect significant scatter from cluster to cluster. The low-mass end is affected by the Gaia selection function.
Current usage metrics show cumulative count of Article Views (full-text article views including HTML views, PDF and ePub downloads, according to the available data) and Abstracts Views on Vision4Press platform.
Data correspond to usage on the plateform after 2015. The current usage metrics is available 48-96 hours after online publication and is updated daily on week days.
Initial download of the metrics may take a while.