Fig. 23.
Download original image
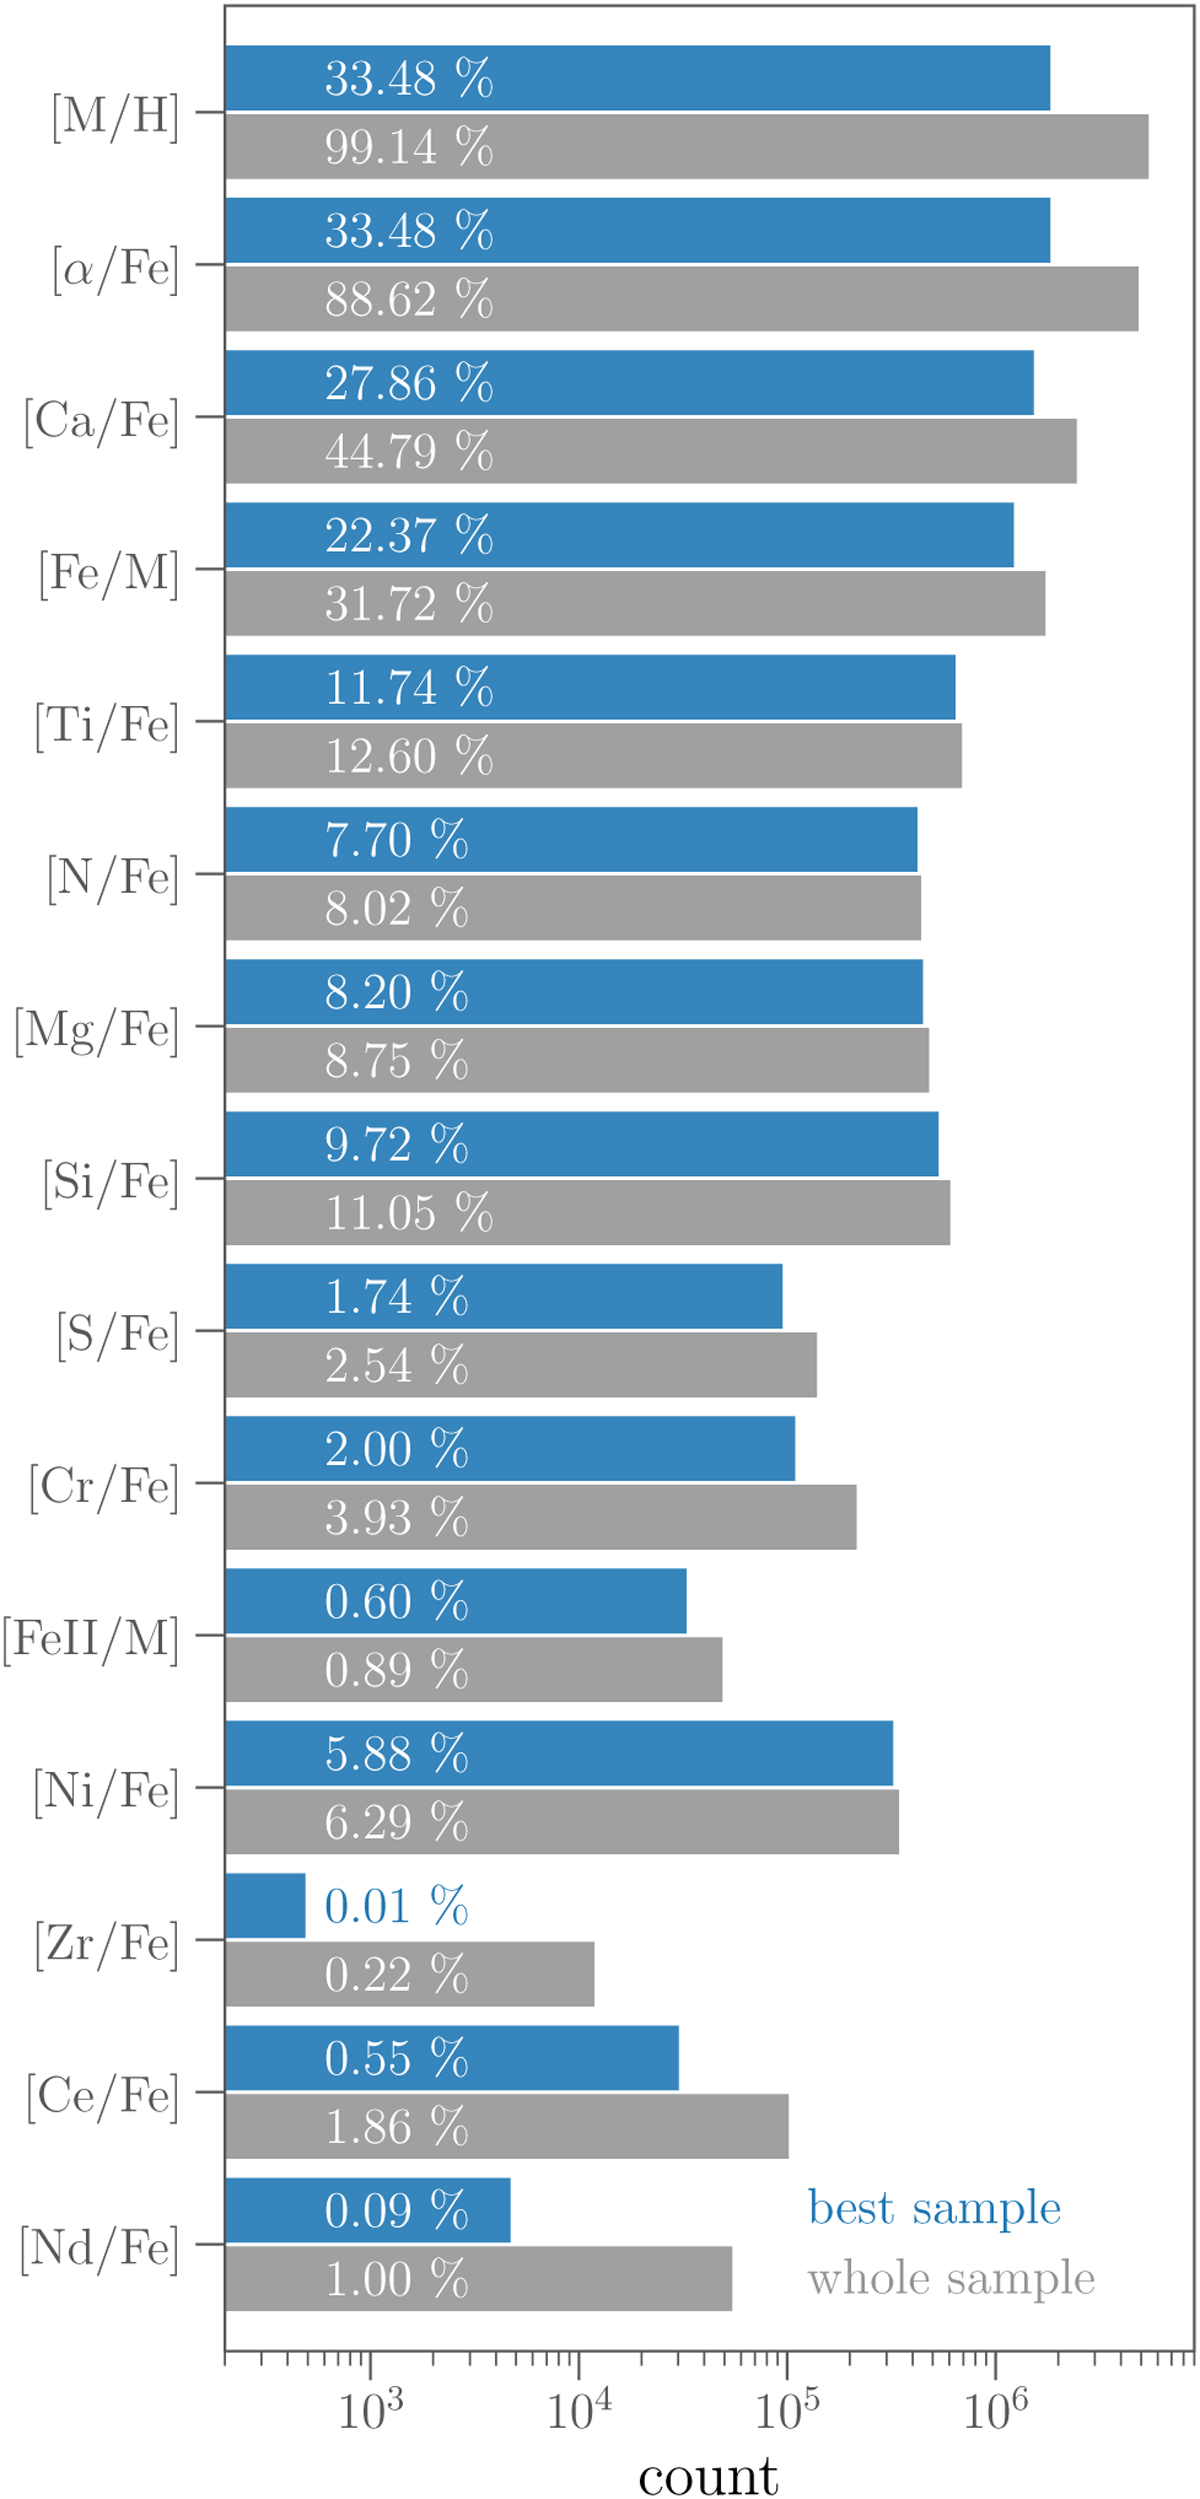
Number of stars with individual abundance ratio estimates from GSP-Spec. The two sets represent the whole sample and the best quality sample (quality flags equal to zero) in grey and blue, respectively. We indicate at the top [M/H] and [α/Fe] for reference (discussed in Sect. 3.2.1). The percentages correspond to the fraction of estimates with respect to the 5 594 205 stars processed by GSP-Spec. On this scale, 1% corresponds to 40 000 stars.
Current usage metrics show cumulative count of Article Views (full-text article views including HTML views, PDF and ePub downloads, according to the available data) and Abstracts Views on Vision4Press platform.
Data correspond to usage on the plateform after 2015. The current usage metrics is available 48-96 hours after online publication and is updated daily on week days.
Initial download of the metrics may take a while.