Fig. 20.
Download original image
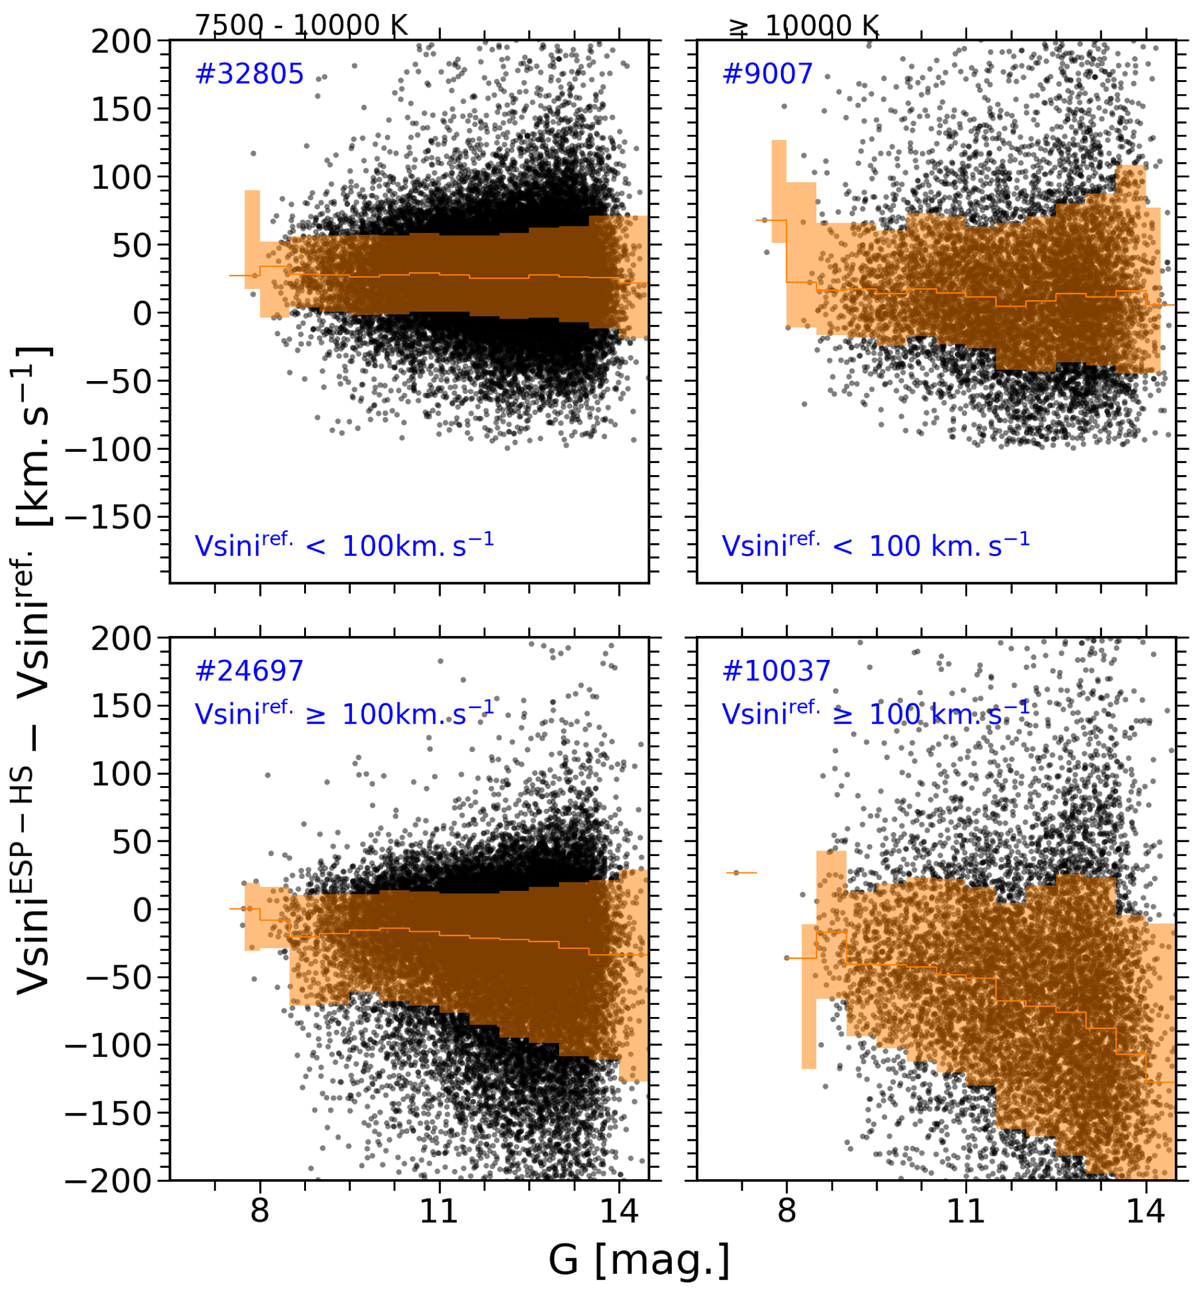
Distribution with G magnitude of the differences between the LAMOST OBA results (v sin iref.) and ESP-HS v sin i measurement. Stars cooler and hotter than 10 000 K are plotted in the left and right panels, respectively. A distinction is also made between slow (upper panel) and rapid (lower panel) rotators. The running median is shown in orange, while the interquartile dispersion (at 14.85% and 85.15%) is represented by the orange shades.
Current usage metrics show cumulative count of Article Views (full-text article views including HTML views, PDF and ePub downloads, according to the available data) and Abstracts Views on Vision4Press platform.
Data correspond to usage on the plateform after 2015. The current usage metrics is available 48-96 hours after online publication and is updated daily on week days.
Initial download of the metrics may take a while.