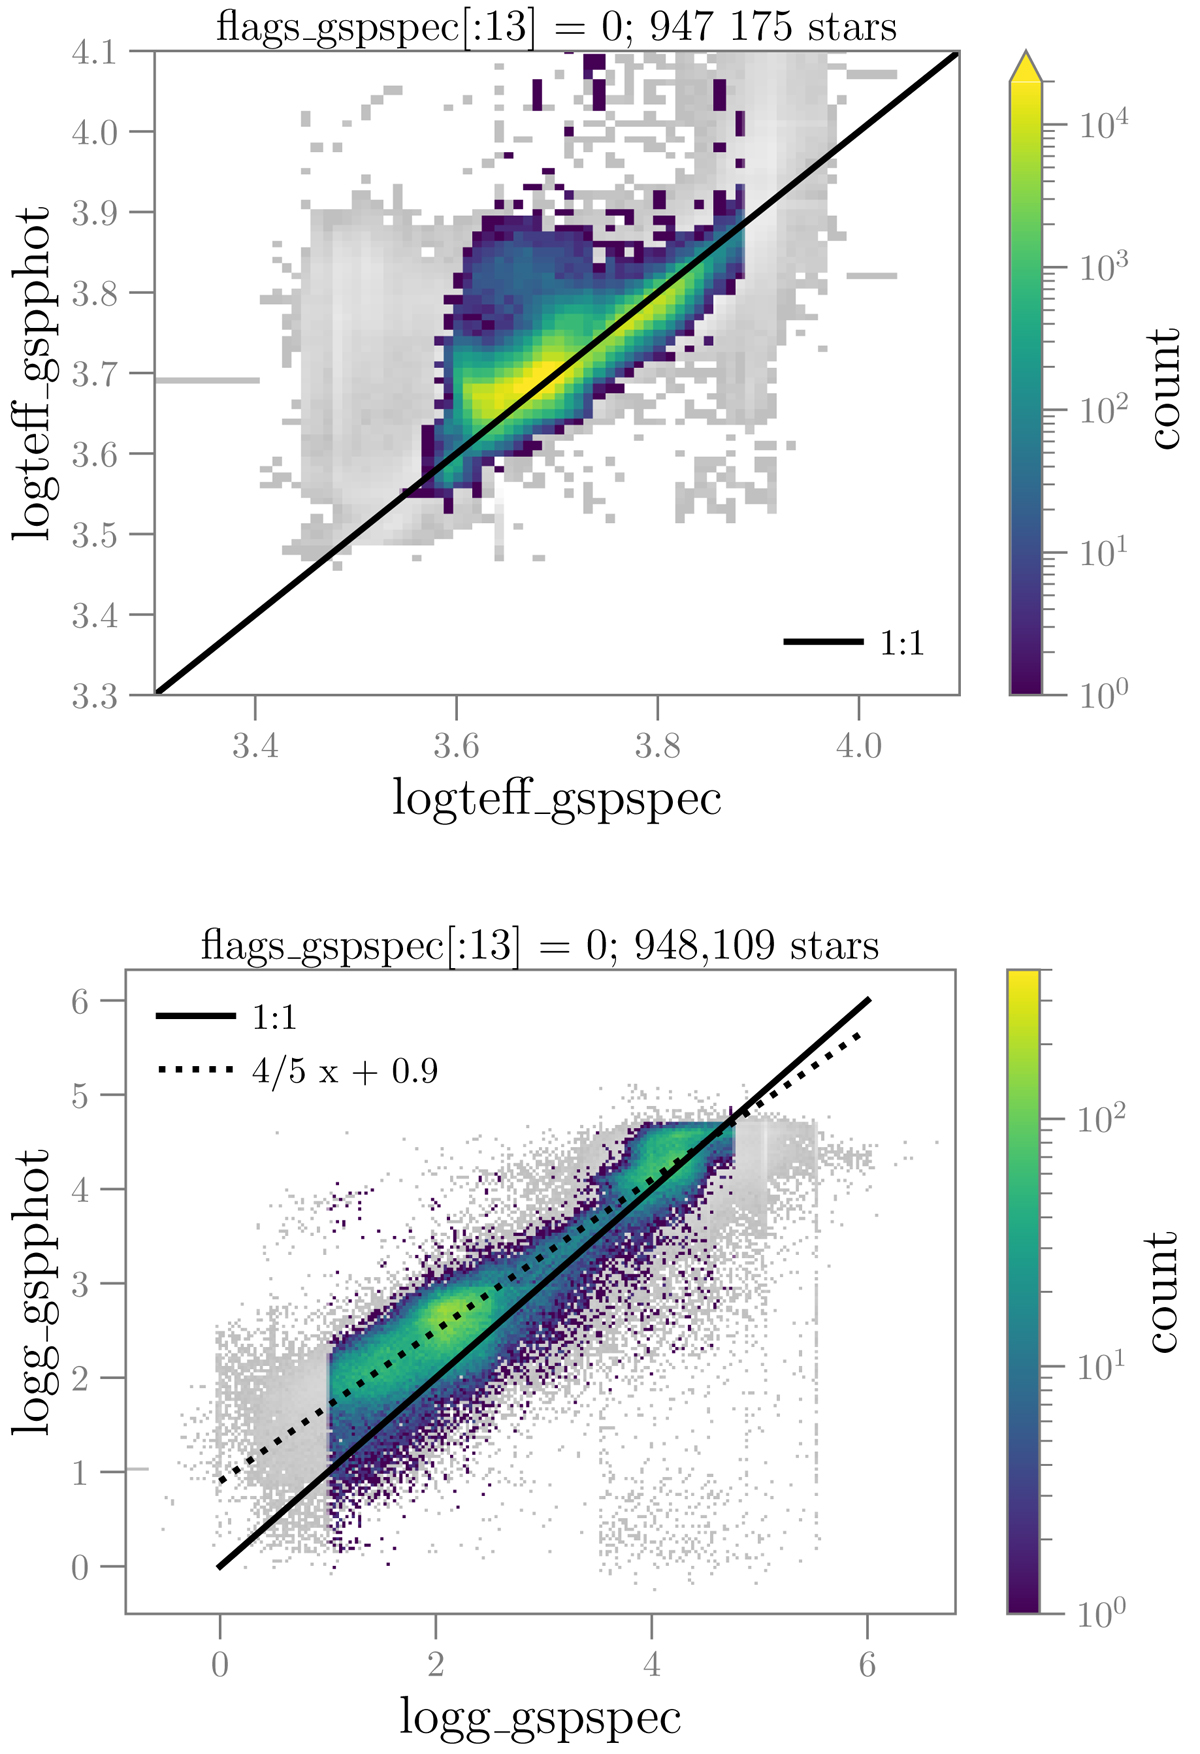
Fig. 14.
Download original image
Comparison of the temperatures (top) and surface gravity (bottom) estimates from GSP-Phot and GSP-Spec. The GSP-Phot and GSP-Spec algorithms are calibrated to the literature values. We plot in grey the ∼3.2 million sources in Gaia DR3 with both astrophysical_parameters.teff_gspphot, astrophysical_parameters.teff_gspspec and astrophysical_parameters.logg_gspphot, logg_gspspec. The highlighted distribution corresponds to those with the first 13 values in flags_gspspec equal to zero (∼1 million sources). We indicate the identity lines and the identified divergence in log g between the modules. We note that the GSP-Spec recommended calibration of log g does not affect this comparison significantly.
Current usage metrics show cumulative count of Article Views (full-text article views including HTML views, PDF and ePub downloads, according to the available data) and Abstracts Views on Vision4Press platform.
Data correspond to usage on the plateform after 2015. The current usage metrics is available 48-96 hours after online publication and is updated daily on week days.
Initial download of the metrics may take a while.