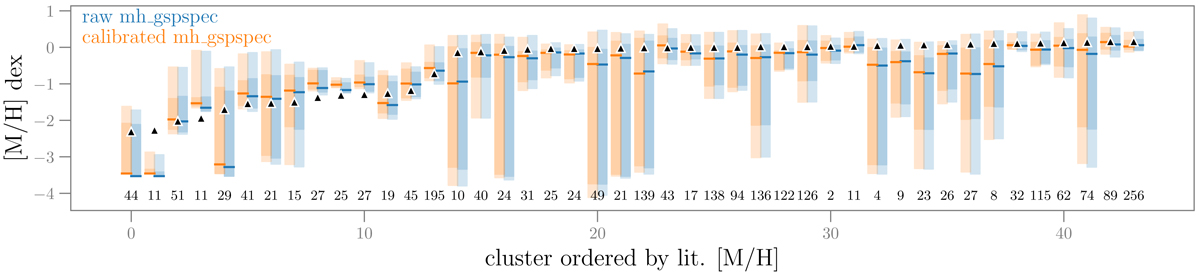
Fig. 12.
Download original image
[M/H] abundance distributions of member stars per cluster for the GSP-Spec Matisse-Gauguin algorithm (astrophysical_parameters.mh_gspspec) before and after recommended adjustements (see Sect. 3.2.1) The clusters are ordered by ascending [M/H] literature values (the lowest values to the left). These literature values are given by the black triangles. Cantat-Gaudin et al. (2020) provided the cluster members. Marks indicate the median of the distributions, and shaded regions indicate the 68% and 98% intervals. Numbers at the bottom indicate how many estimates were available to represent the distribution. Ideally, all predictions are within a small interval, which agrees with the triangles. We did not filter the estimates using the flags to keep enough stars per cluster, but nevertheless, the agreement is remarkable.
Current usage metrics show cumulative count of Article Views (full-text article views including HTML views, PDF and ePub downloads, according to the available data) and Abstracts Views on Vision4Press platform.
Data correspond to usage on the plateform after 2015. The current usage metrics is available 48-96 hours after online publication and is updated daily on week days.
Initial download of the metrics may take a while.