Fig. 1.
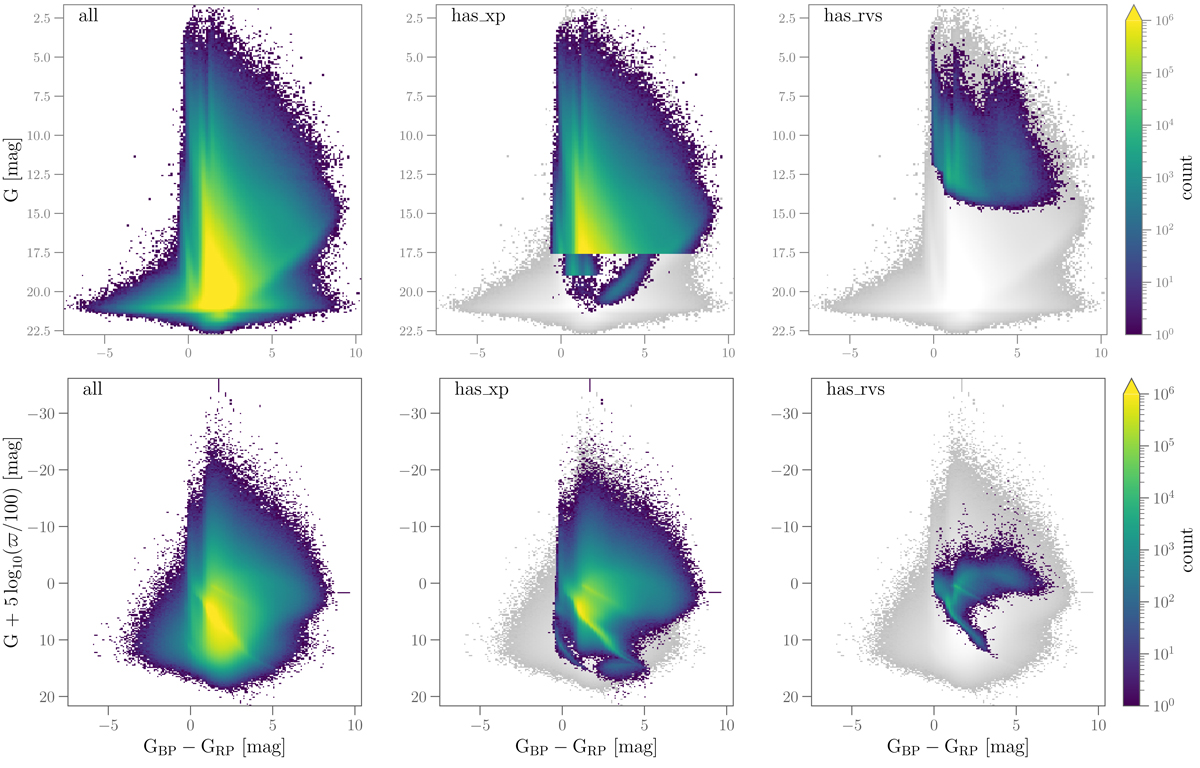
Download original image
Distribution of the sources in colour–magnitude space processed by Apsis according to the available measurements. The top panels show the observed colour-magnitude diagram. In contrast, the bottom panels show their absolute magnitude computed using the inverse parallax as the distance and assuming zero extinction for sources with positive parallax measurements. From left to right, the sources with G, BP, and RP photometry (“all”), those with published BP/RP spectra (gaia_source.has_xp_continuous), and those with RVS spectra (gaia_source.has_rvs). The gray density in the middle and right panels indicates the entire sample for reference. The peculiar distribution of BP/RP fainter than G = 17.65 mag in the top middle panel corresponds to selected UCDs (red sources) and extragalactic sources (blue sources). The inverse parallax used in the bottom panels includes low-quality parallaxes that cause the unphysically high brightness of many sources.
Current usage metrics show cumulative count of Article Views (full-text article views including HTML views, PDF and ePub downloads, according to the available data) and Abstracts Views on Vision4Press platform.
Data correspond to usage on the plateform after 2015. The current usage metrics is available 48-96 hours after online publication and is updated daily on week days.
Initial download of the metrics may take a while.