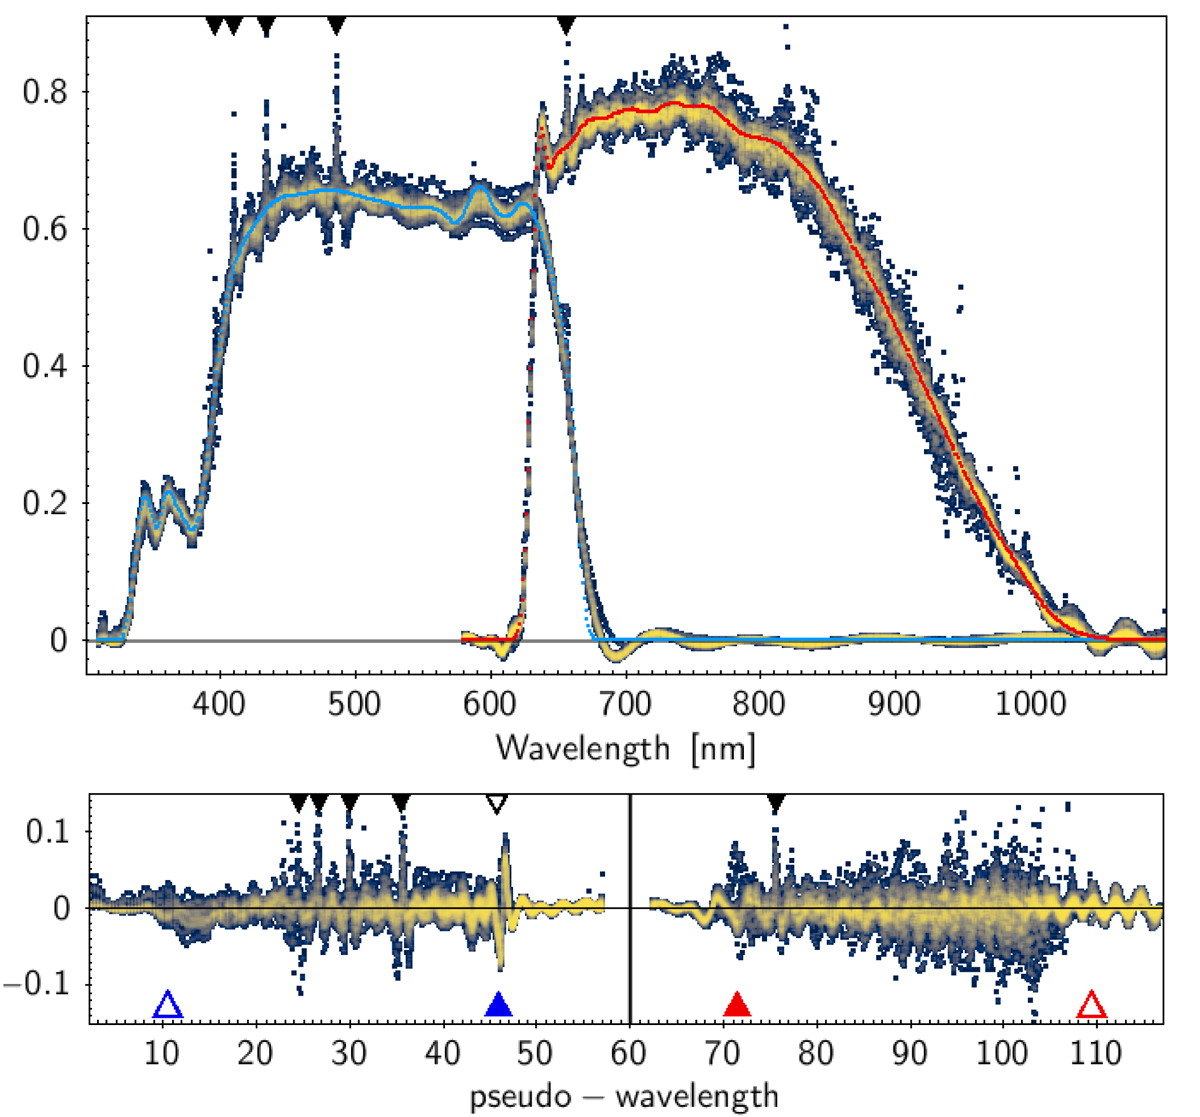
Fig. 8.

Download original image
BP and RP response curves traced by the ratio between effective SPD computed from BP and RP spectra and source SPDs from ground-based observations. Top: data are plotted against wavelength; black triangles mark the position of Balmer lines. Bottom: residuals between data and the response models are plotted against pseudo-wavelengths. BP pseudo-wavelengths have been swapped left-to-right, while RP data are shifted by 60 samples. Blue- and red-filled triangles mark the position of BP and RP cut-of, f respectively, while blue and red open triangles show where the response drops to zero.
Current usage metrics show cumulative count of Article Views (full-text article views including HTML views, PDF and ePub downloads, according to the available data) and Abstracts Views on Vision4Press platform.
Data correspond to usage on the plateform after 2015. The current usage metrics is available 48-96 hours after online publication and is updated daily on week days.
Initial download of the metrics may take a while.


