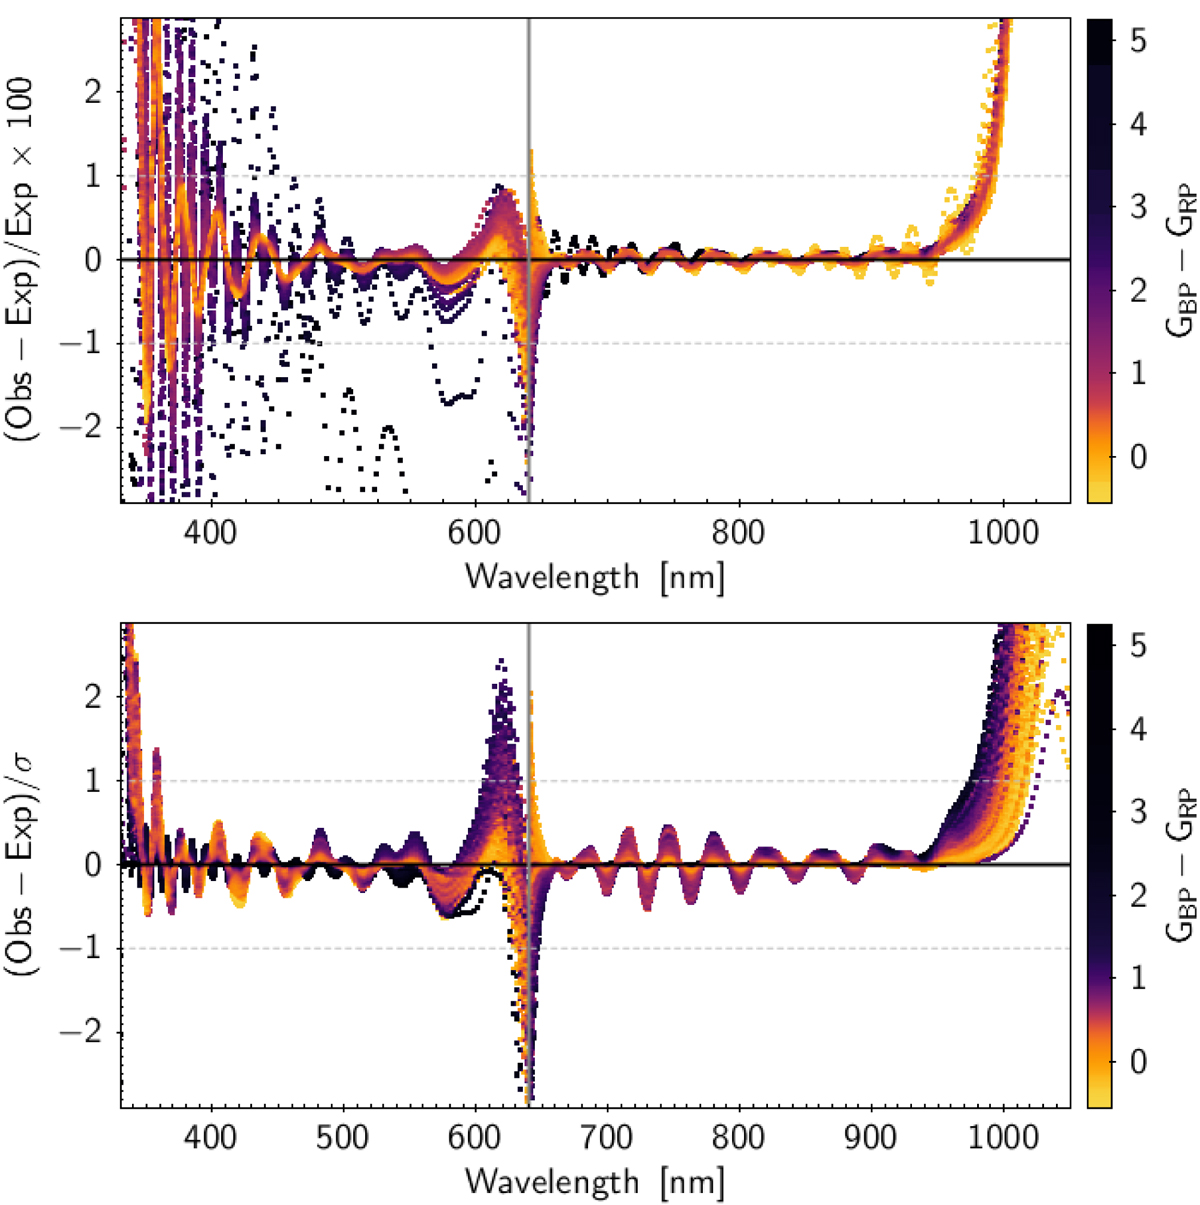
Fig. 39.

Download original image
Effect of the reconstruction error on ECS. Top: percentage residuals between mean BP/RP fluxes and corresponding forward modelled mean spectra computed from the ECS and instrument models as a function of wavelength; the plot uses data for the full set of SPSS, PVL, and NGSL samples. Bottom: residuals are normalised by the model error. In both cases, the colour map encodes the GBP − GRP colour index, while horizontal dashed lines placed at ±1 provide a reference. The vertical grey line at λ = 640 sets the separation between BP and RP data.
Current usage metrics show cumulative count of Article Views (full-text article views including HTML views, PDF and ePub downloads, according to the available data) and Abstracts Views on Vision4Press platform.
Data correspond to usage on the plateform after 2015. The current usage metrics is available 48-96 hours after online publication and is updated daily on week days.
Initial download of the metrics may take a while.


