Fig. 9.
Download original image
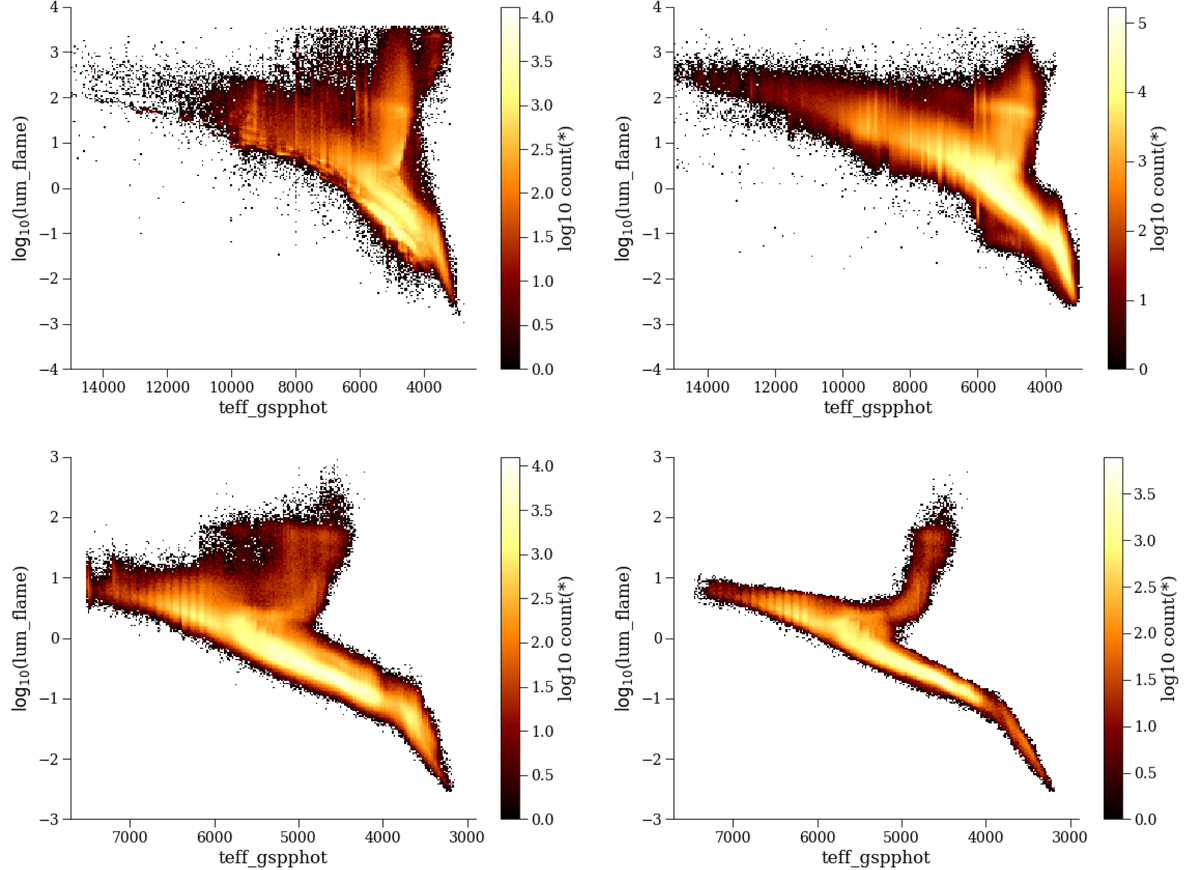
HR diagram based on GSP-Phot and FLAME for the definition of the FGKM sample. Top left panel: illustrates the HR diagram before any selection is made using a random sample of 2 Million stars. The rest of the panels show the various quality cuts. Top right: fgkm_1, bottom left is fgkm_2, and bottom right is fgkm_3 before cleaning for variables and binaries.
Current usage metrics show cumulative count of Article Views (full-text article views including HTML views, PDF and ePub downloads, according to the available data) and Abstracts Views on Vision4Press platform.
Data correspond to usage on the plateform after 2015. The current usage metrics is available 48-96 hours after online publication and is updated daily on week days.
Initial download of the metrics may take a while.