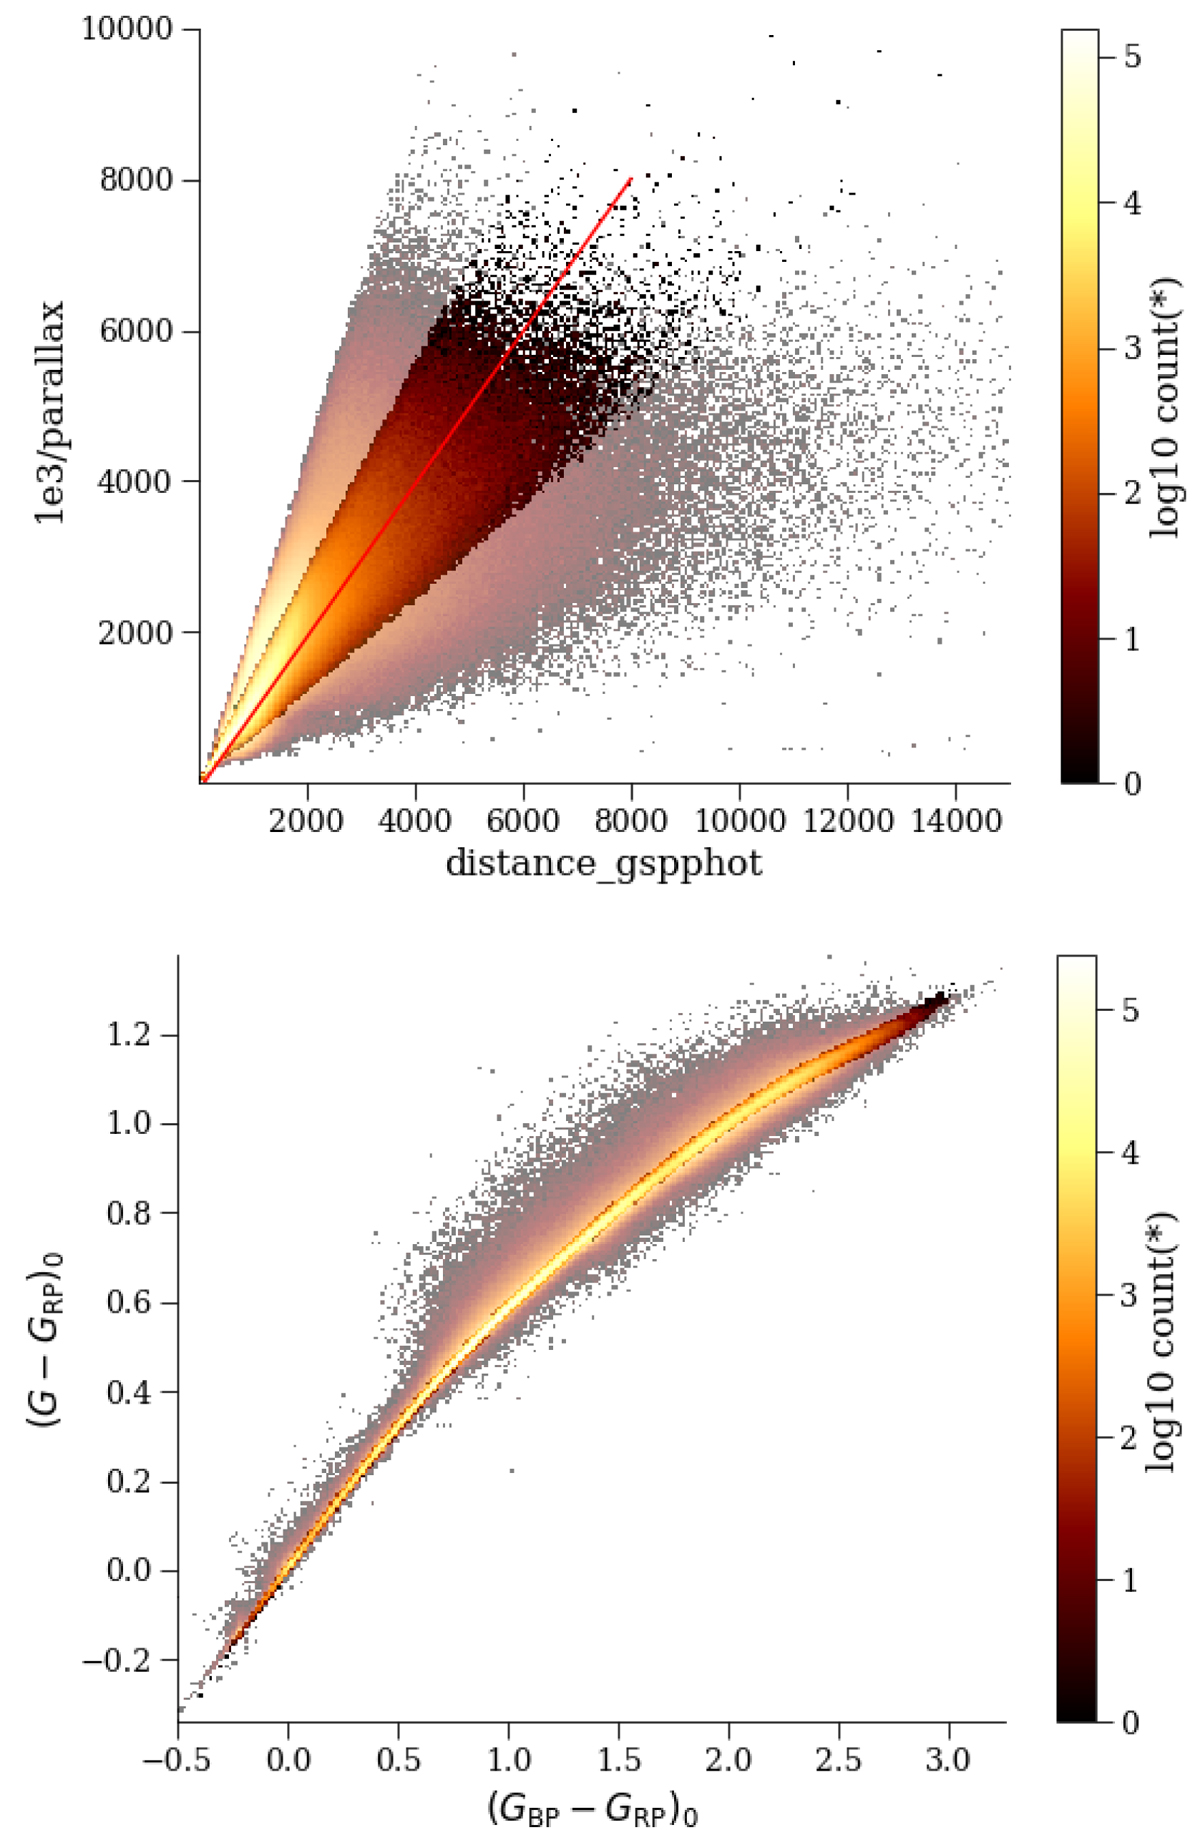
Fig. 7.
Download original image
Comparisons between sample fgkm_1 and intermediate samples based on some of the criteria used to define sample fgkm_2. Top panel: illustrates the distance–parallax–error constraint and the lower panel shows the (G − GRP)0 − (GBP − GRP)0 relation after imposing the colour–Teff and colour–colour cuts described in Sect. 4.2. In both panels, the sources in fgkm_1 are shown in the background, while those satisfying the criteria are illustrated in the foreground, colour-coded according to logarithmic count.
Current usage metrics show cumulative count of Article Views (full-text article views including HTML views, PDF and ePub downloads, according to the available data) and Abstracts Views on Vision4Press platform.
Data correspond to usage on the plateform after 2015. The current usage metrics is available 48-96 hours after online publication and is updated daily on week days.
Initial download of the metrics may take a while.