Fig. 6.
Download original image
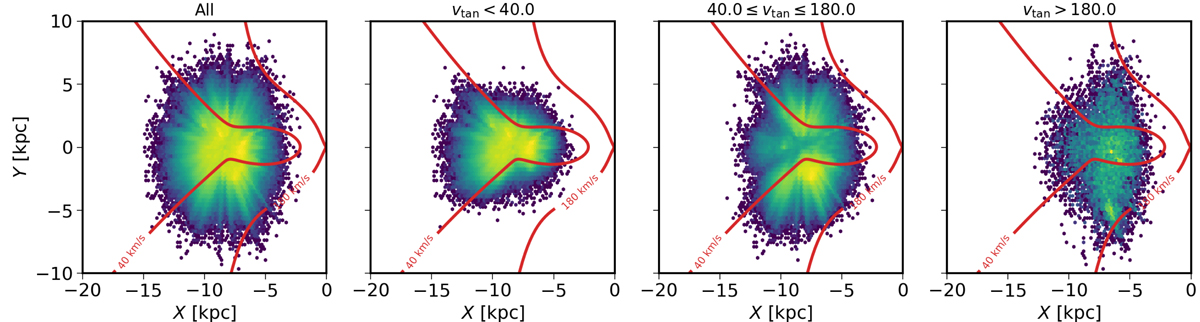
Distribution of stars in the OBA sample projected on the Galactic plane. The Galactic centre is to the right at (X, Y) = (0, 0) and the Sun is at ( − 8, 0). From left to right, the panels show the full sample (with ϖ/σϖ > 10) and the samples selected according to the vtan ranges indicated. The red contours indicate lines of constant vtan, calculated with the simple kinematic disc model as explained in the text.
Current usage metrics show cumulative count of Article Views (full-text article views including HTML views, PDF and ePub downloads, according to the available data) and Abstracts Views on Vision4Press platform.
Data correspond to usage on the plateform after 2015. The current usage metrics is available 48-96 hours after online publication and is updated daily on week days.
Initial download of the metrics may take a while.