Open Access
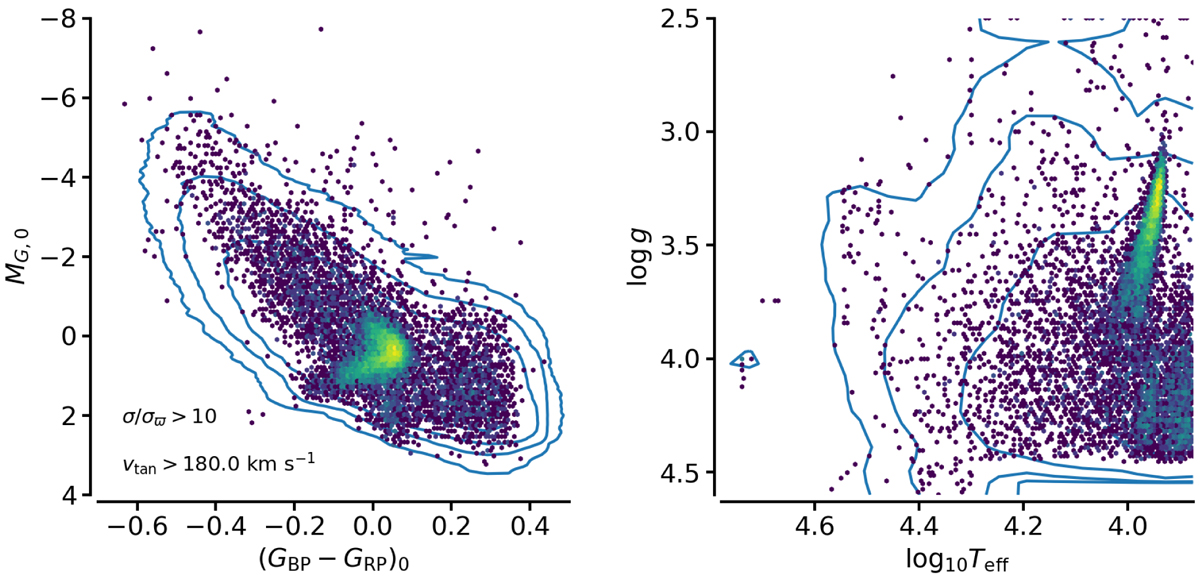
Fig. 5.
Download original image
Distribution of the parameters of the OBA sample with ϖ/σϖ > 10 and vtan > 180 km s−1. Left: observational HR diagram. Right: Kiel diagram. The contours indicate the distribution of the full sample. The colour code indicates the density of sources satisfying the above criteria.
Current usage metrics show cumulative count of Article Views (full-text article views including HTML views, PDF and ePub downloads, according to the available data) and Abstracts Views on Vision4Press platform.
Data correspond to usage on the plateform after 2015. The current usage metrics is available 48-96 hours after online publication and is updated daily on week days.
Initial download of the metrics may take a while.