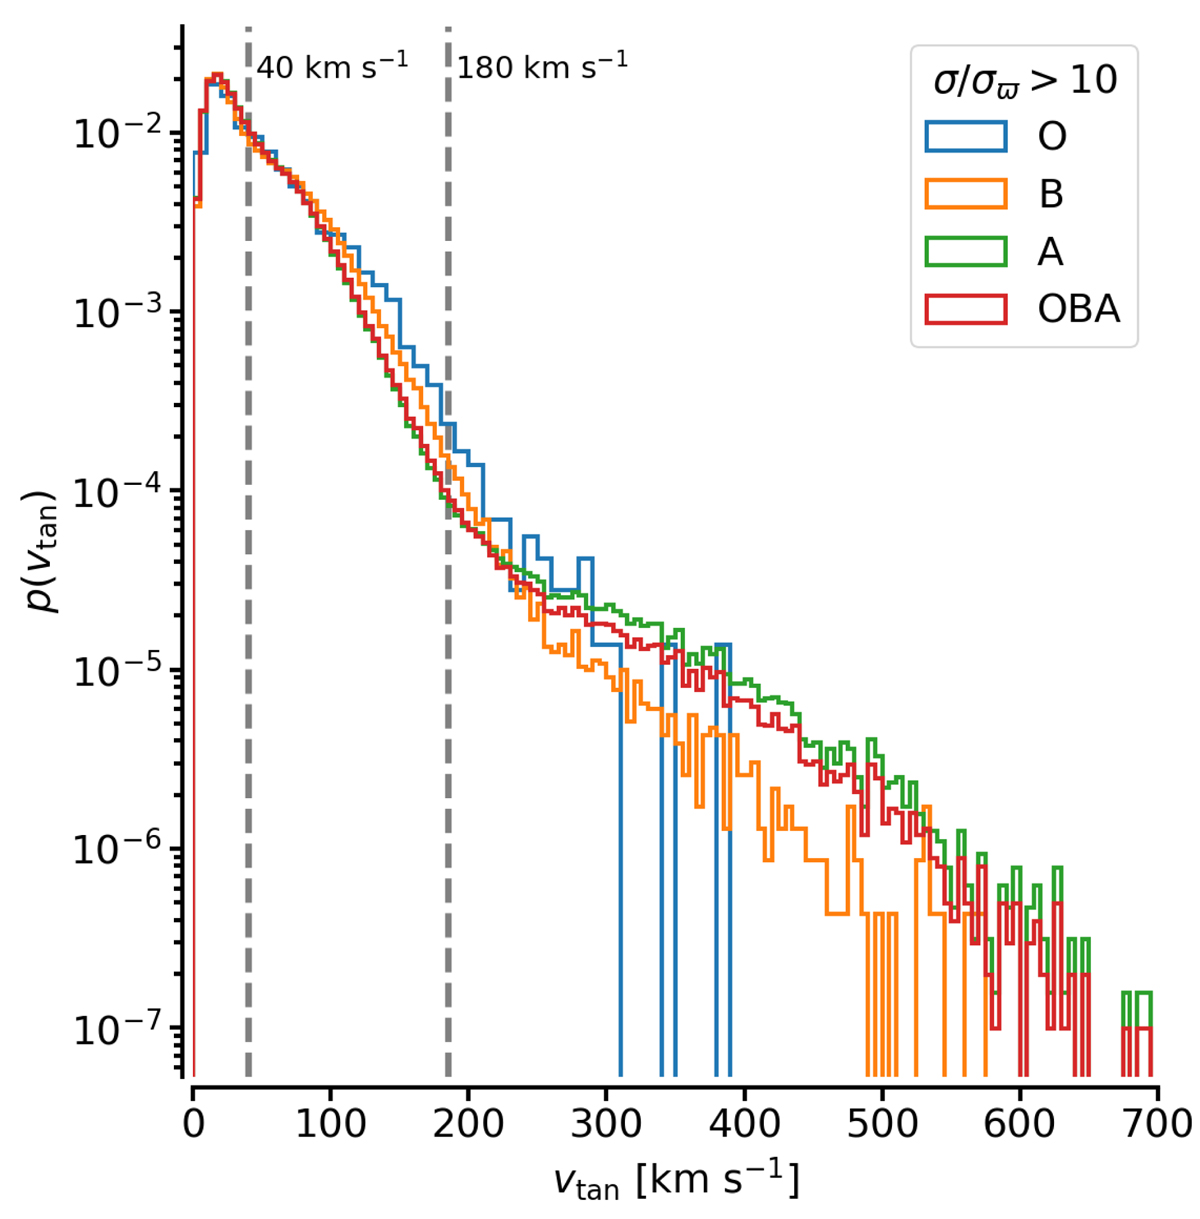
Fig. 3.
Download original image
Histogram of tangential velocities of the stars in the OBA sample with ϖ/σϖ > 10. The combined OBA star sample is shown as well as the individual O, B, and A star samples (based on the classifications from the ESP-HS module). The limits in tangential velocity separating the thin disc, thick disc, and halo populations are shown as vertical dashed lines.
Current usage metrics show cumulative count of Article Views (full-text article views including HTML views, PDF and ePub downloads, according to the available data) and Abstracts Views on Vision4Press platform.
Data correspond to usage on the plateform after 2015. The current usage metrics is available 48-96 hours after online publication and is updated daily on week days.
Initial download of the metrics may take a while.