Fig. 29.
Download original image
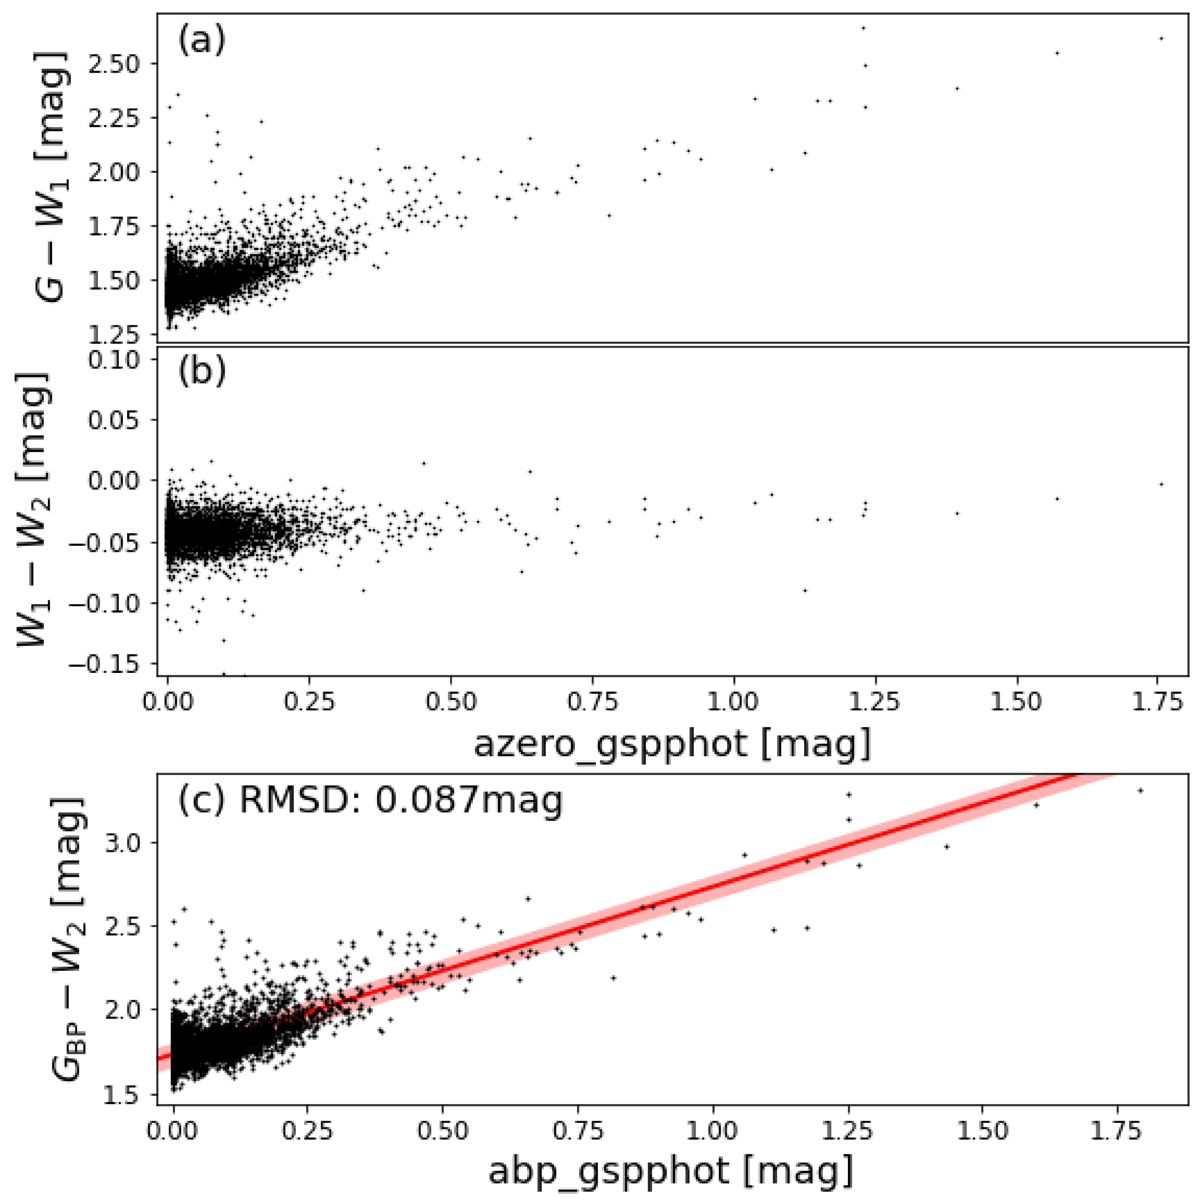
Colours of GSP-Spec solar-analogue candidates as a function of GSP-Phot extinction estimates. W1 and W2 denote AllWISE photometry (Cutri et al. 2021). We restrict the comparison to candidates with W1 > 8 mag, because AllWISE photometry suffers from saturation for brighter sources. Panel c: the red line is a linear increase with abp_gspphot offset by the mean GBP − W2 colour of 589 stars where A0 < 0.001 mag according to GSP-Phot. The red interval marks the uncertainty from the standard deviation of the mean. The quoted root-mean-square (RMS) difference is between the GBP − W2 colour and abp_gspphot plus the mean.
Current usage metrics show cumulative count of Article Views (full-text article views including HTML views, PDF and ePub downloads, according to the available data) and Abstracts Views on Vision4Press platform.
Data correspond to usage on the plateform after 2015. The current usage metrics is available 48-96 hours after online publication and is updated daily on week days.
Initial download of the metrics may take a while.