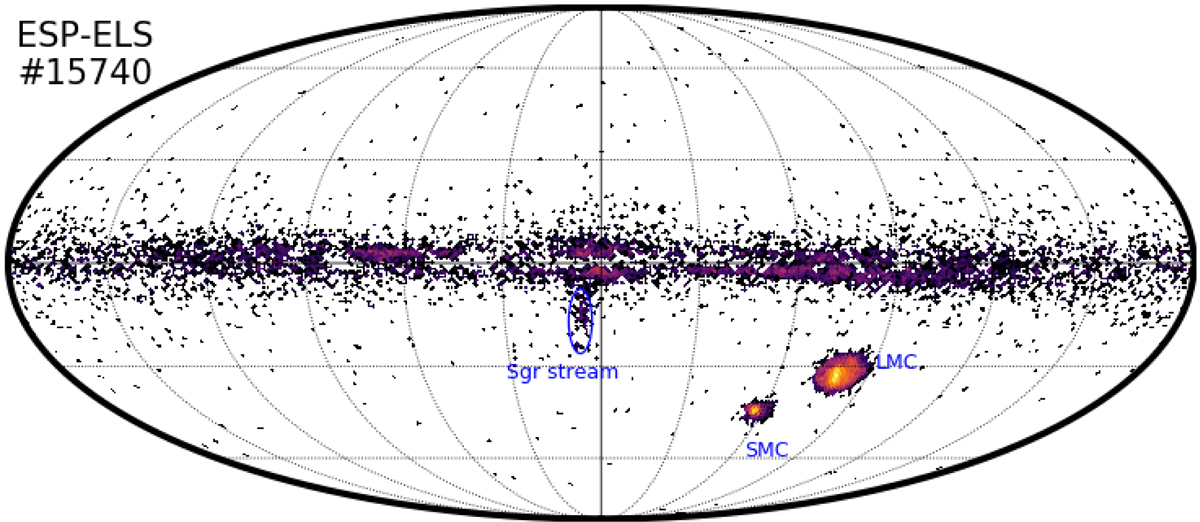
Fig. 24.

Download original image
Magnitude and colour distribution of carbon stars. Left panels: vertical black dashed line shows the upper magnitude limit of the data processed by ESP-ELS. Upper panels: all the targets belonging to the golden sample of carbon stars are taken into account. Other panels: distributions obtained for the known MW (Alksnis et al. 2001), LMC (Kontizas et al. 2001), and SMC (Morgan & Hatzidimitriou 1995) carbon stars are shown in blue. In orange, we show the distribution of the targets in common with the sample we propose in this work.
Current usage metrics show cumulative count of Article Views (full-text article views including HTML views, PDF and ePub downloads, according to the available data) and Abstracts Views on Vision4Press platform.
Data correspond to usage on the plateform after 2015. The current usage metrics is available 48-96 hours after online publication and is updated daily on week days.
Initial download of the metrics may take a while.


