Open Access
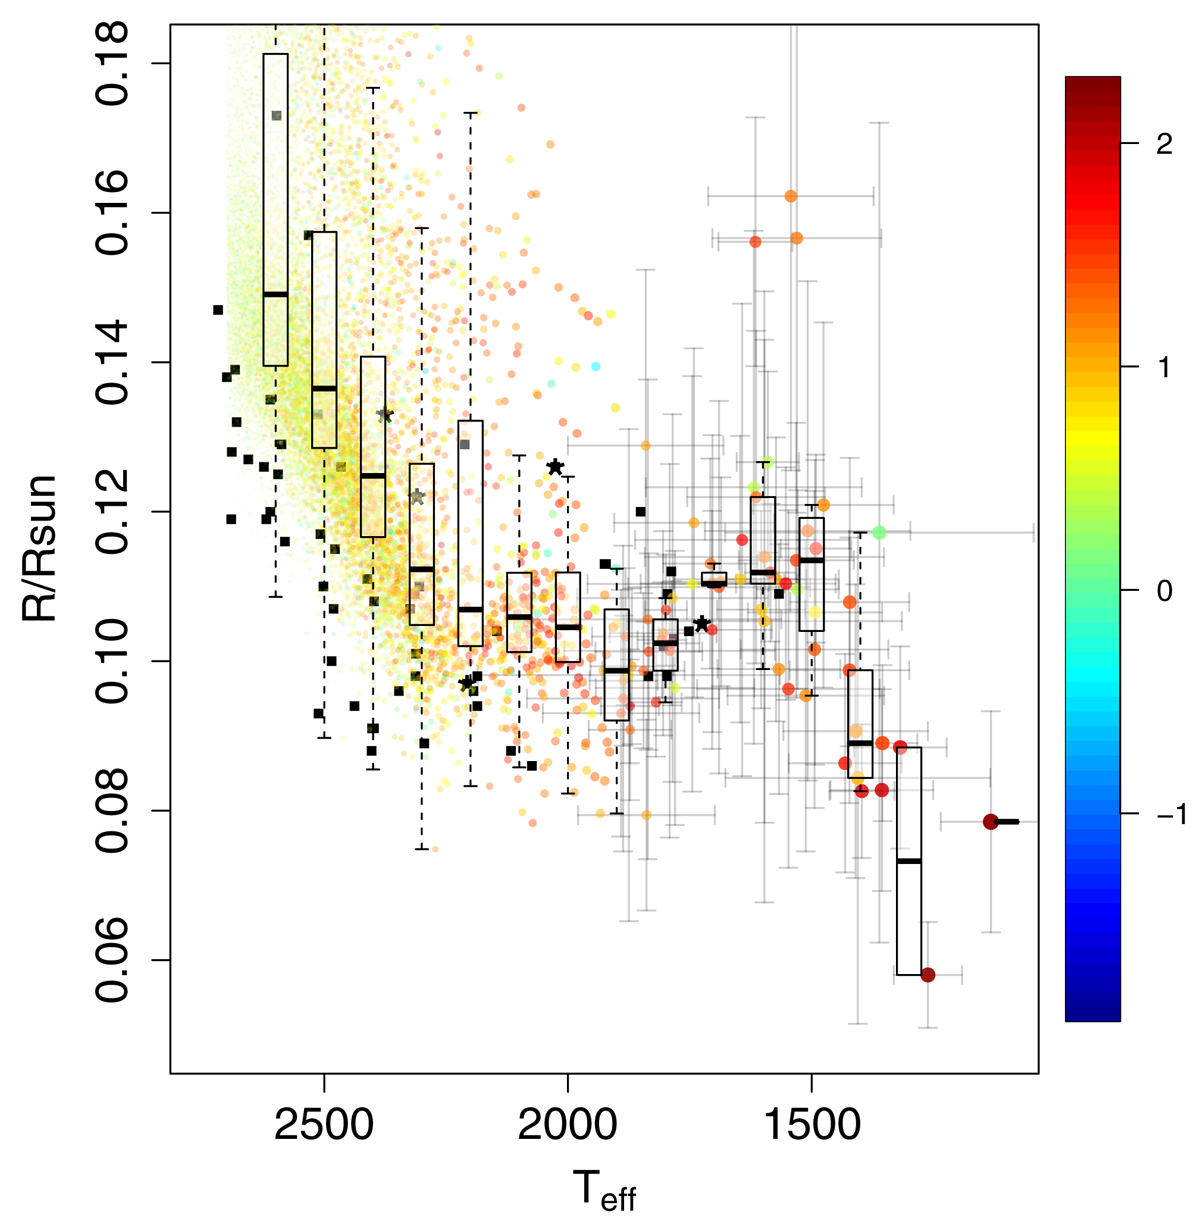
Fig. 17.
Download original image
Radii of candidate UCDs in the Gaia golden sample. The colour code indicates the logarithm of the VOSA fit χ2 values, squares represent the data points in Table 1 of Dieterich et al. (2014), and black asterisks denote unresolved binaries therein. The box plots are calculated within bins of 100 K.
Current usage metrics show cumulative count of Article Views (full-text article views including HTML views, PDF and ePub downloads, according to the available data) and Abstracts Views on Vision4Press platform.
Data correspond to usage on the plateform after 2015. The current usage metrics is available 48-96 hours after online publication and is updated daily on week days.
Initial download of the metrics may take a while.