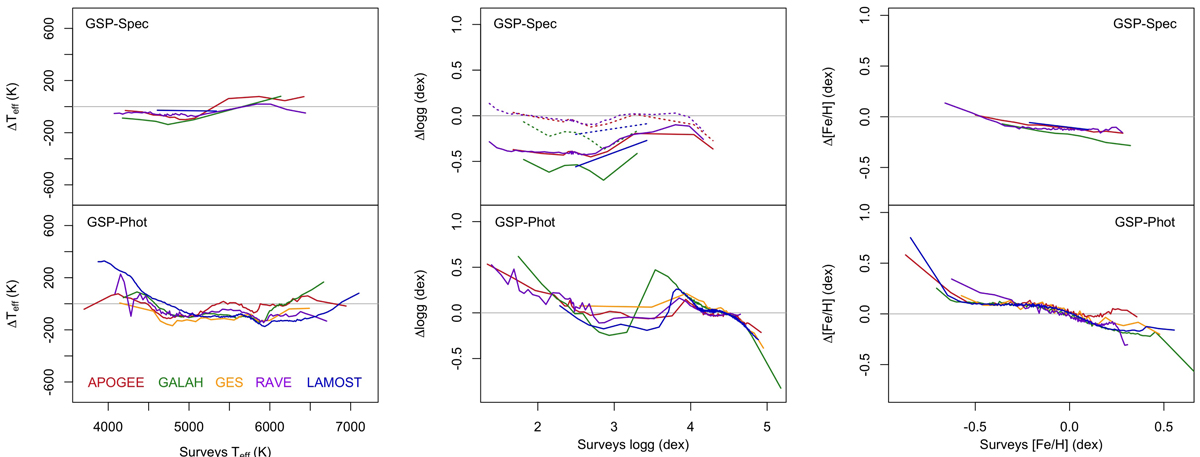
Fig. 15.
Download original image
Comparison of atmospheric parameters with the spectroscopic surveys for the FGKM sample. Top panels: comparison of GSP-Spec parameters and the bottom panels GSP-Phot. Left panels: the case of Teff, the middle panels that of log g, and the right panels that of [Fe/H]. The differences on the y-axes are the Gaia values minus the other survey values, where the latter are calculated as the median values in equally populated bins (solid lines, coloured according to the legend in the bottom-left panel). The dotted lines for the GSP-Spec log g are obtained after the corrections recommended by Recio-Blanco et al. (2023).
Current usage metrics show cumulative count of Article Views (full-text article views including HTML views, PDF and ePub downloads, according to the available data) and Abstracts Views on Vision4Press platform.
Data correspond to usage on the plateform after 2015. The current usage metrics is available 48-96 hours after online publication and is updated daily on week days.
Initial download of the metrics may take a while.