Fig. 1.
Download original image
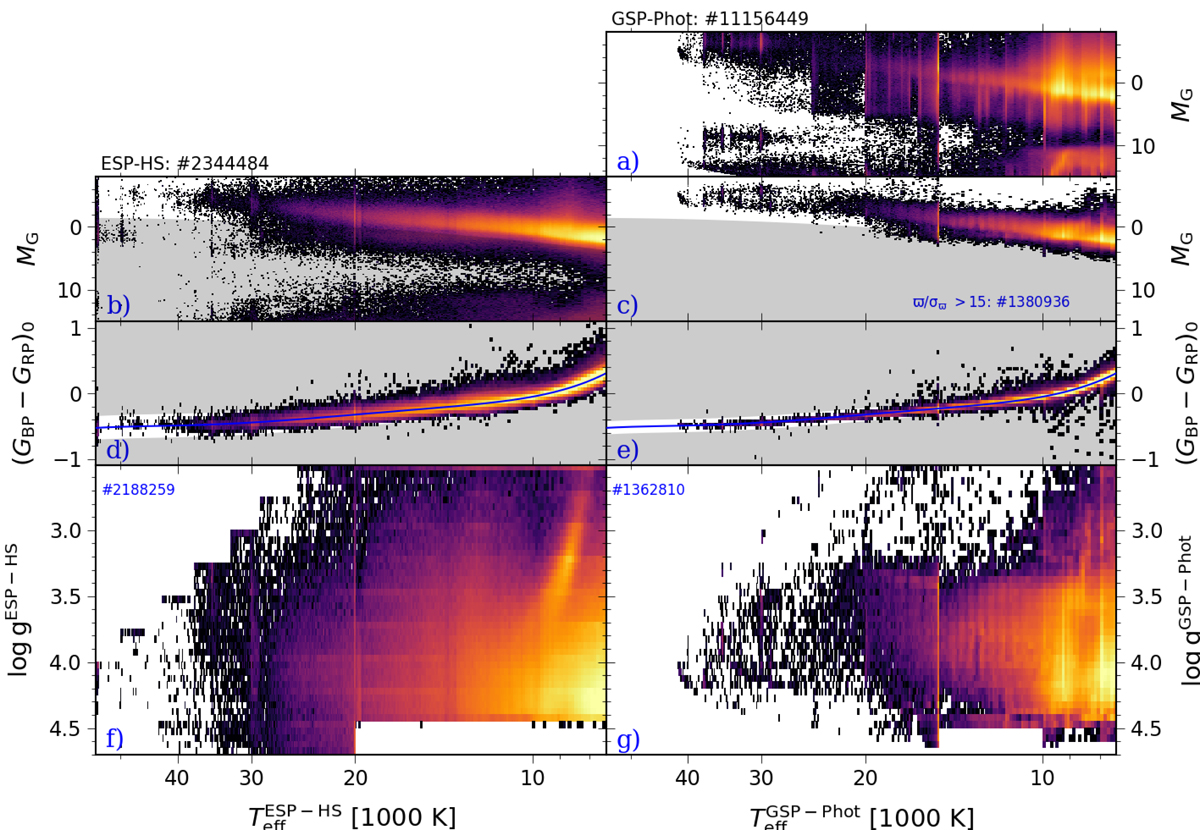
Selection of the OBA sample. Left and right panels: the OBA samples from ESP-HS and GSP-Phot, respectively. A first filter on the parallax (S/N) is applied to the GSP-Phot targets (from panels a to c). For both samples, subluminous targets are removed (grey shading in panels b and c), and then the outliers at six standard deviations from the expected colour vs. Teff relation (blue line) are filtered out (grey shading in panels d and e). The absolute magnitude MG is computed using the measured parallax and the estimated interstellar extinction AG provided by both modules. The de-reddened colour, (GBP − GRP)0, is derived using the value of E(GBP − GRP). The resulting Kiel diagrams are shown in the bottom rows (panels f and g). The over-densities seen at Teff = 15 000 K, 20 000 K, and 30 000 K are linked to the temperature limits of the adopted synthetic spectra libraries.
Current usage metrics show cumulative count of Article Views (full-text article views including HTML views, PDF and ePub downloads, according to the available data) and Abstracts Views on Vision4Press platform.
Data correspond to usage on the plateform after 2015. The current usage metrics is available 48-96 hours after online publication and is updated daily on week days.
Initial download of the metrics may take a while.