Open Access
Fig. 5.
Download original image
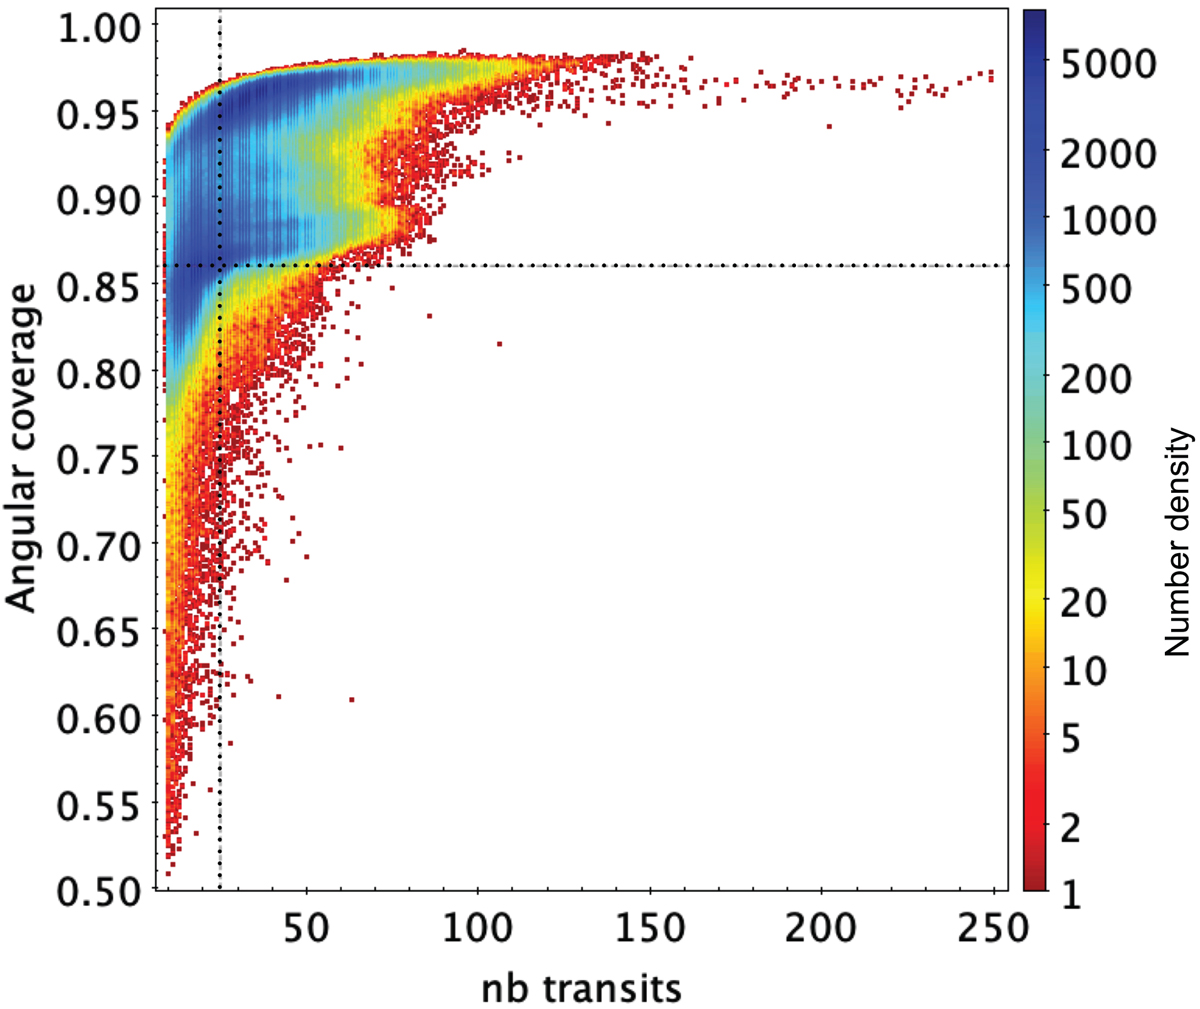
Density plot of the distribution of angular coverage of quasars and galaxies as a function of their number of transits. Sources with less than 25 transits or with a coverage < 86% are discarded from the analysis. These limits are indicated by the dotted lines.
Current usage metrics show cumulative count of Article Views (full-text article views including HTML views, PDF and ePub downloads, according to the available data) and Abstracts Views on Vision4Press platform.
Data correspond to usage on the plateform after 2015. The current usage metrics is available 48-96 hours after online publication and is updated daily on week days.
Initial download of the metrics may take a while.