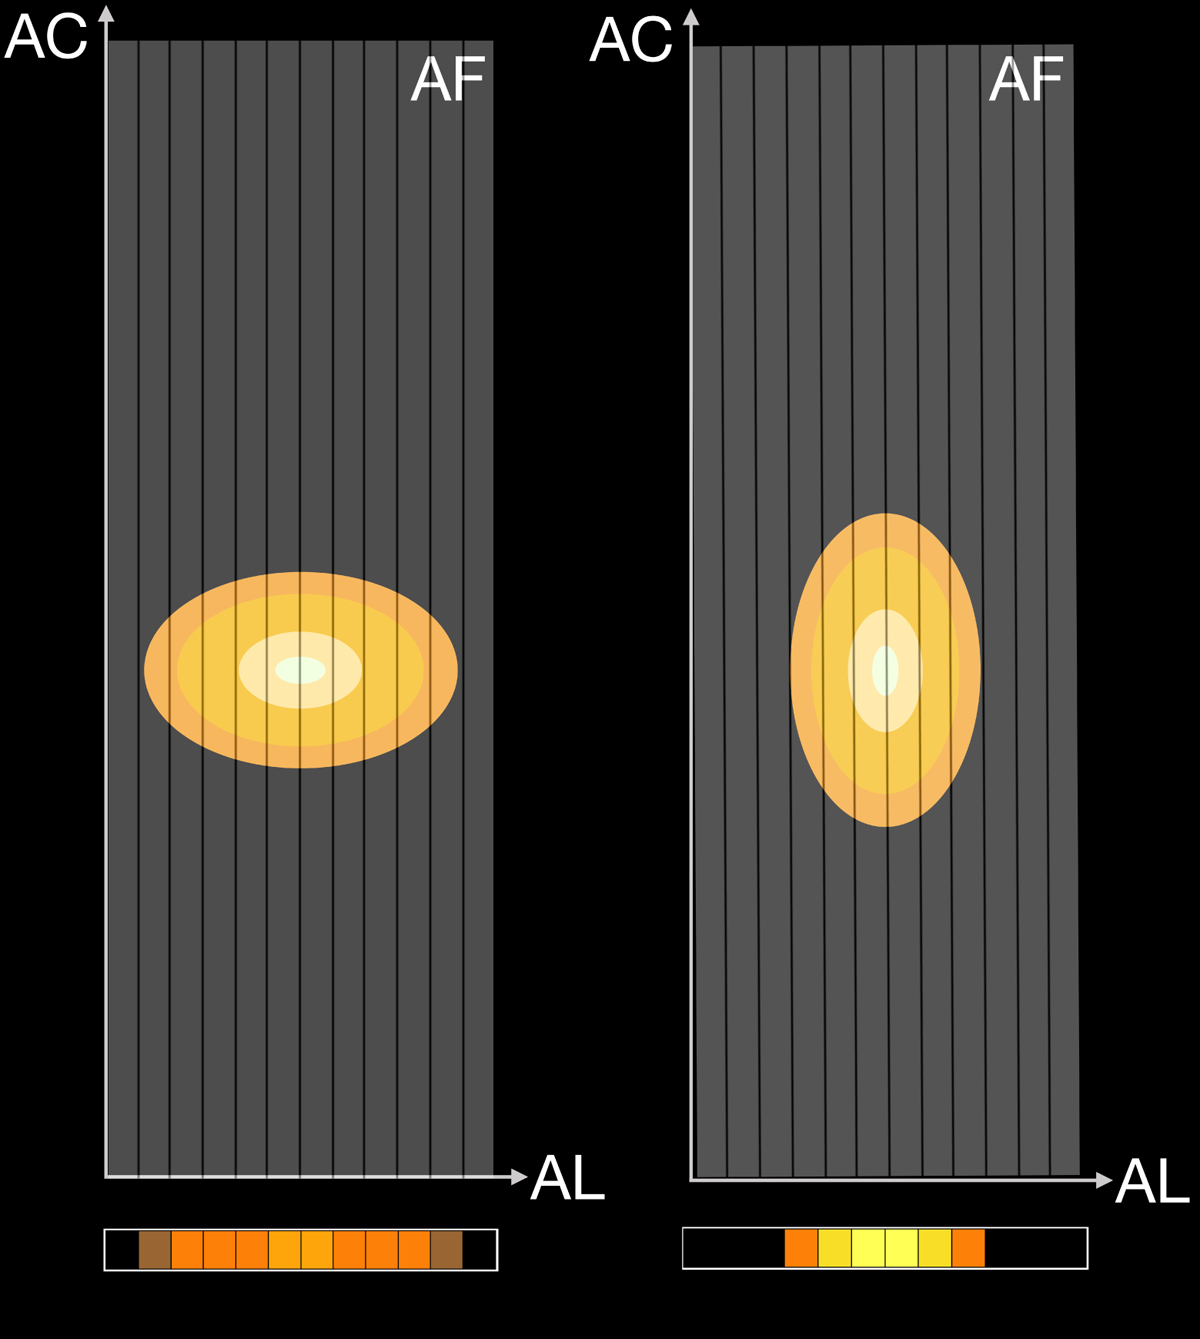
Fig. 10.
Download original image
Illustration of the observation by AF of an extended and elongated source when the scan direction (AL) is along the major axis (left) or along the minor axis (right) of the source. The resulting observed windows are given at the bottom of the figure. The colours illustrate the amount of flux collected in the different samples. When scanned along minor axis, the observations present an over-brightness at the centre. This effect is also seen in the SM detector.
Current usage metrics show cumulative count of Article Views (full-text article views including HTML views, PDF and ePub downloads, according to the available data) and Abstracts Views on Vision4Press platform.
Data correspond to usage on the plateform after 2015. The current usage metrics is available 48-96 hours after online publication and is updated daily on week days.
Initial download of the metrics may take a while.