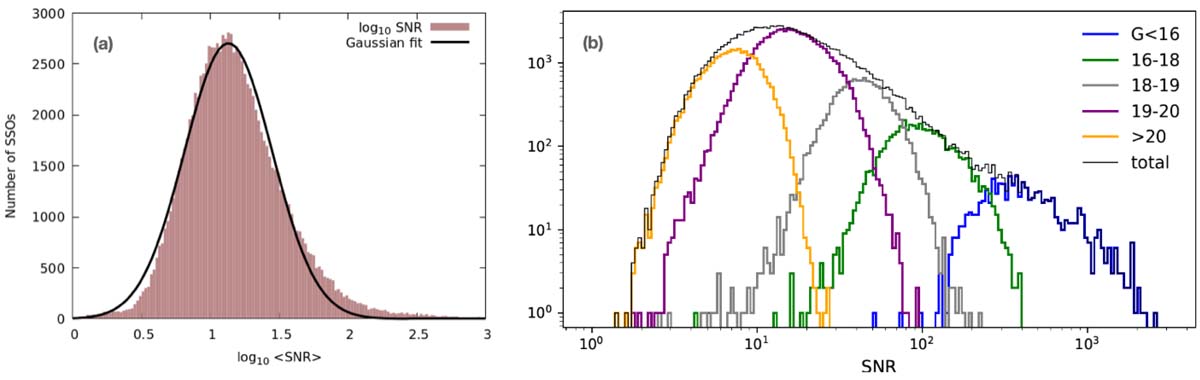
Fig. 8.
Download original image
(a) Mean ⟨S/N⟩ for the 111818 SSOs for which the pipeline produced mean reflectance spectra. (b) ⟨S/N⟩ for the 111 818 SSOs of different magnitude classes. Each G-band magnitude class is represented by a separate curve (from right to left): SSOs brighter than 16 mag, between 16 mag and 18 mag, between 18 mag and 19 mag, between 19 mag and 20 mag, and fainter than 20 mag. The dark grey enclosing curve is the global histogram of ⟨S/N⟩, the same shown in Panel a.
Current usage metrics show cumulative count of Article Views (full-text article views including HTML views, PDF and ePub downloads, according to the available data) and Abstracts Views on Vision4Press platform.
Data correspond to usage on the plateform after 2015. The current usage metrics is available 48-96 hours after online publication and is updated daily on week days.
Initial download of the metrics may take a while.