Fig. 7.
Download original image
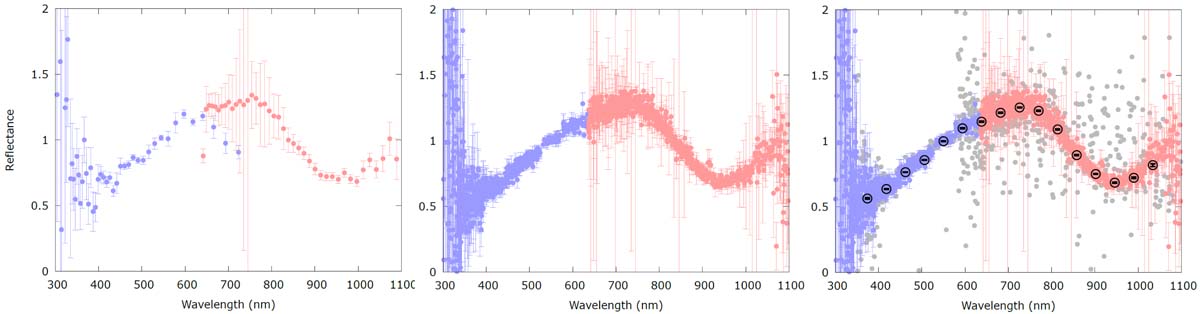
Illustration of the procedure adopted to compute mean reflectance spectra. The SSO chosen as an example here is (1459) Magnya, which is a basaltic asteroid presenting a deep 950 nm-centred absorption band and a red-sloped spectrum. Left panel: one epoch reflectance spectrum is plotted. BP and RP data are blue and red respectively. Middle panel: all epoch reflectance spectra of Magnya are plotted. Right panel: data filtered out by our sigma-clipping procedure are shown in grey; the over-plotted black dots correspond to the final average reflectance spectrum sampled in the 16 bands.
Current usage metrics show cumulative count of Article Views (full-text article views including HTML views, PDF and ePub downloads, according to the available data) and Abstracts Views on Vision4Press platform.
Data correspond to usage on the plateform after 2015. The current usage metrics is available 48-96 hours after online publication and is updated daily on week days.
Initial download of the metrics may take a while.