Open Access
Fig. 20.
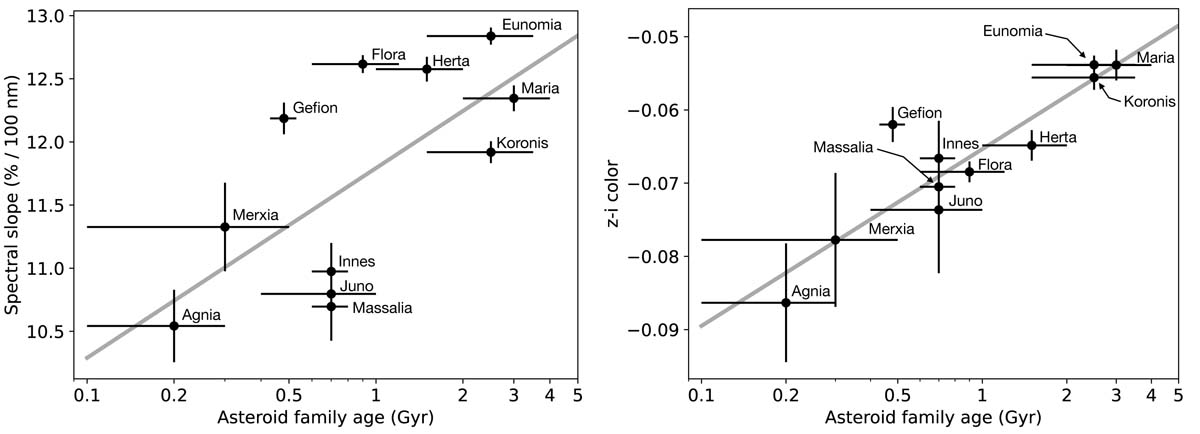
Download original image
Left panel: Gaia DR3 mean and standard deviation of the spectral slope of S-type families plotted against family age. Right panel: mean and standard deviation of the z − i colour of S-type families plotted against family age. No correction for the composition was applied to either of the plots (see Sect. 5).
Current usage metrics show cumulative count of Article Views (full-text article views including HTML views, PDF and ePub downloads, according to the available data) and Abstracts Views on Vision4Press platform.
Data correspond to usage on the plateform after 2015. The current usage metrics is available 48-96 hours after online publication and is updated daily on week days.
Initial download of the metrics may take a while.