Open Access
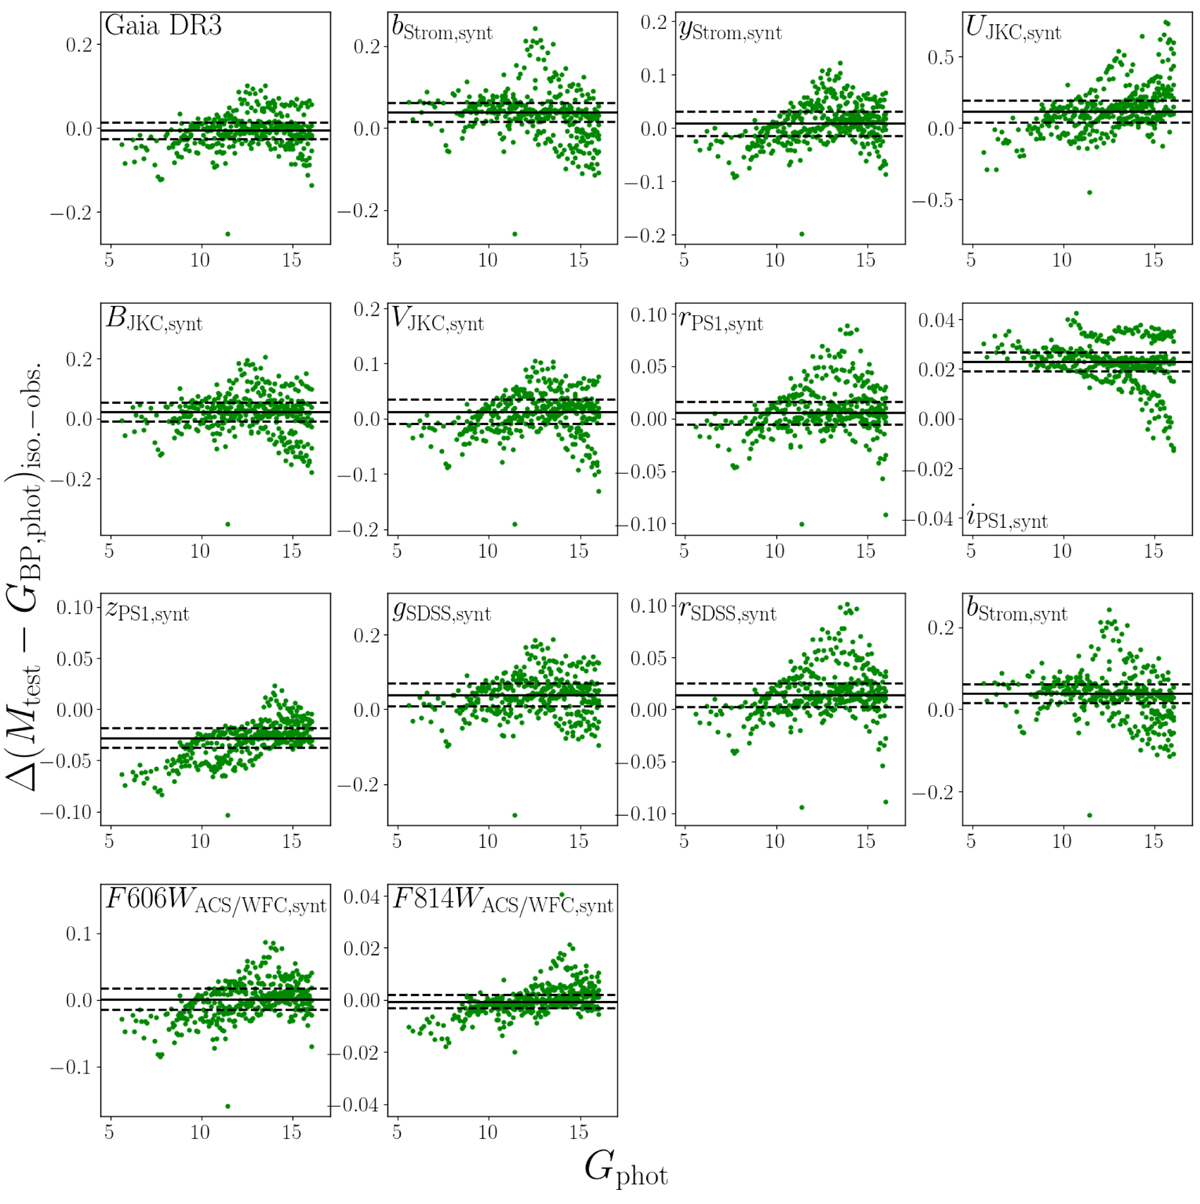
Fig. C.3.
Download original image
As in Fig. C.2: Residuals between the isochrone and the data for the selected OCs. The back solid line is the median of the deviations while the dashed line represents the MAD.
Current usage metrics show cumulative count of Article Views (full-text article views including HTML views, PDF and ePub downloads, according to the available data) and Abstracts Views on Vision4Press platform.
Data correspond to usage on the plateform after 2015. The current usage metrics is available 48-96 hours after online publication and is updated daily on week days.
Initial download of the metrics may take a while.