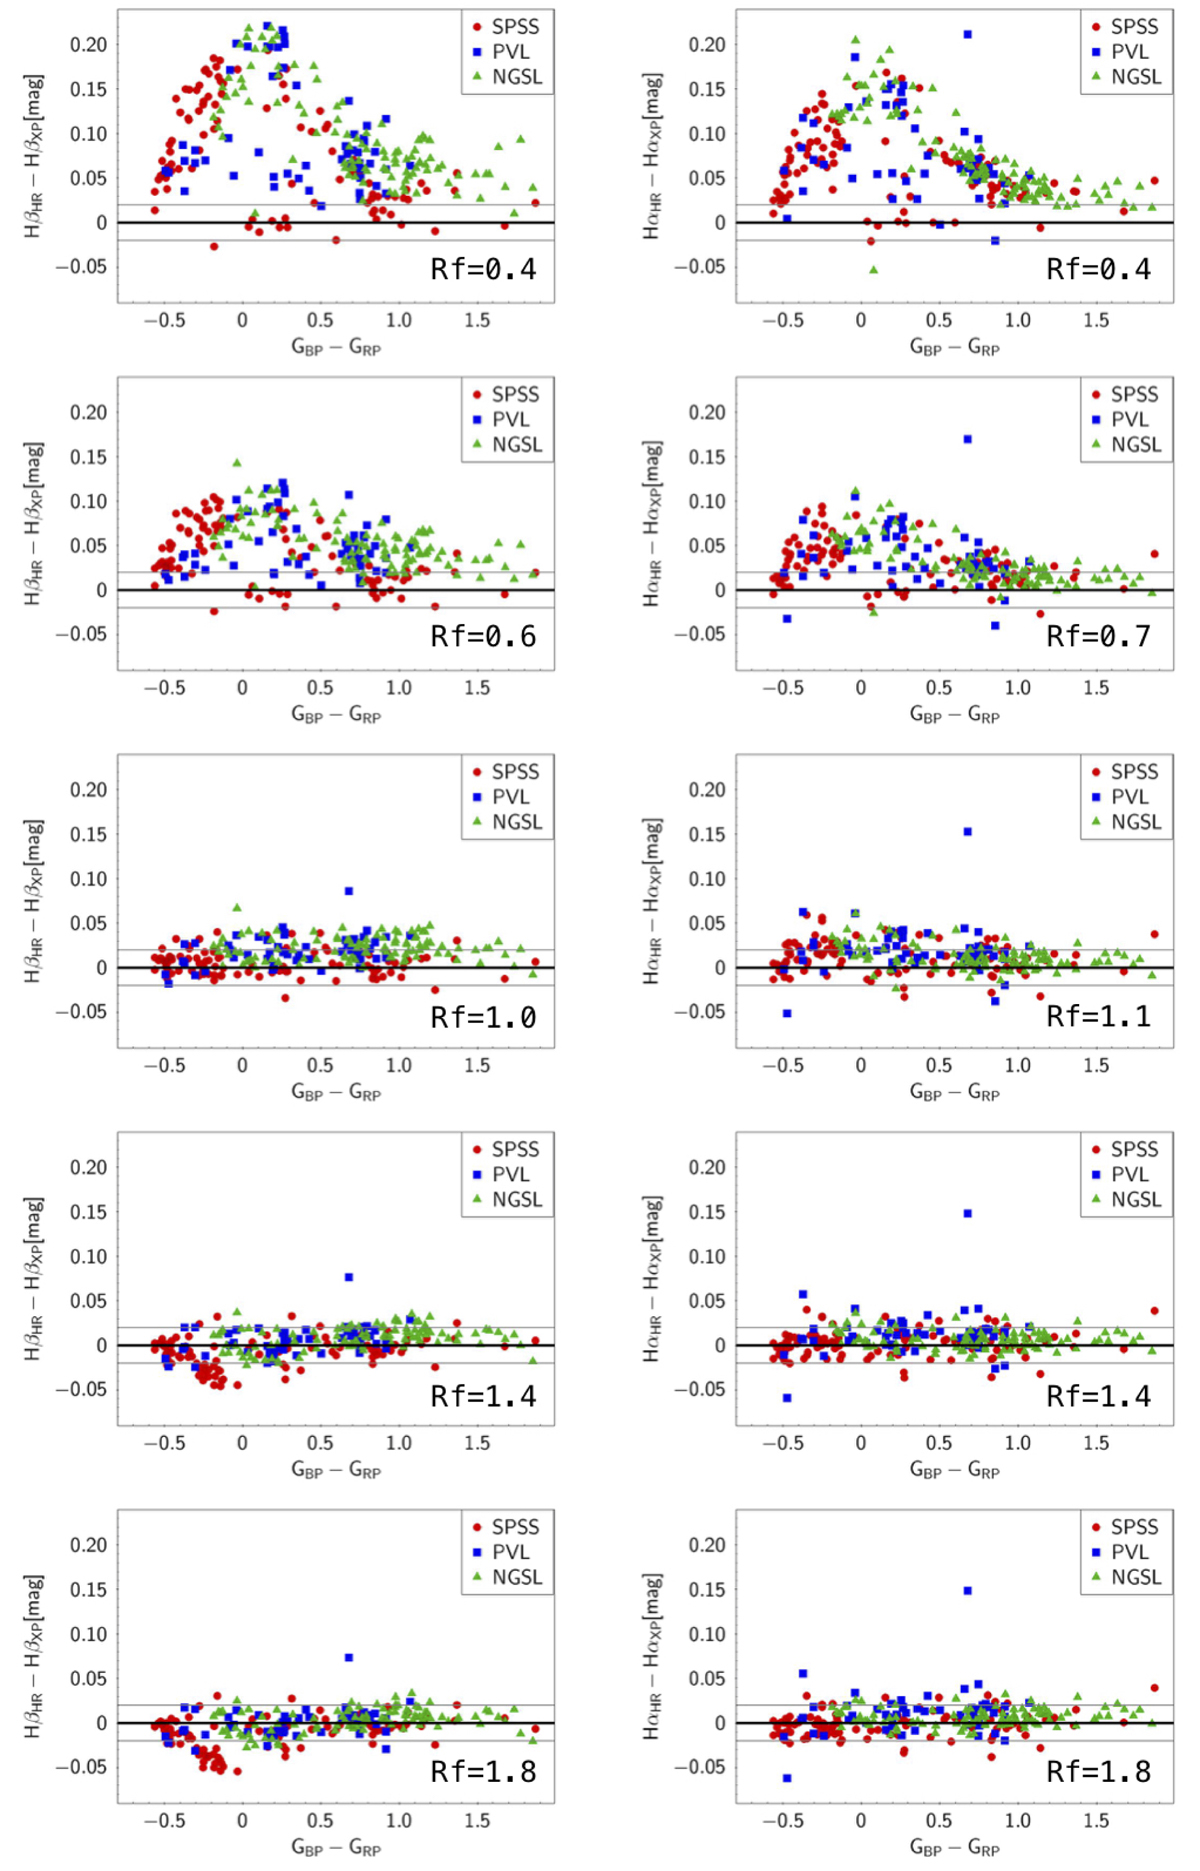
Fig. B.1.
Download original image
Difference in synthetic magnitudes from HR and XP spectra for SPSS, PVL, and selected NGSL using passbands of increasing FWHM (from top to bottom) to measure the flux around Hβ (left panels) and Hα (right panels), as a function of GBP-GRP colour. The passbands FWHM adopted in the various panels are, from top to bottom, 5, 8, 13, 18, 23 nm (Hβ), and 3, 6, 9, 12, 15 nm (Hα). The corresponding Rf values are reported in each panel.
Current usage metrics show cumulative count of Article Views (full-text article views including HTML views, PDF and ePub downloads, according to the available data) and Abstracts Views on Vision4Press platform.
Data correspond to usage on the plateform after 2015. The current usage metrics is available 48-96 hours after online publication and is updated daily on week days.
Initial download of the metrics may take a while.