Fig. 30.
Download original image
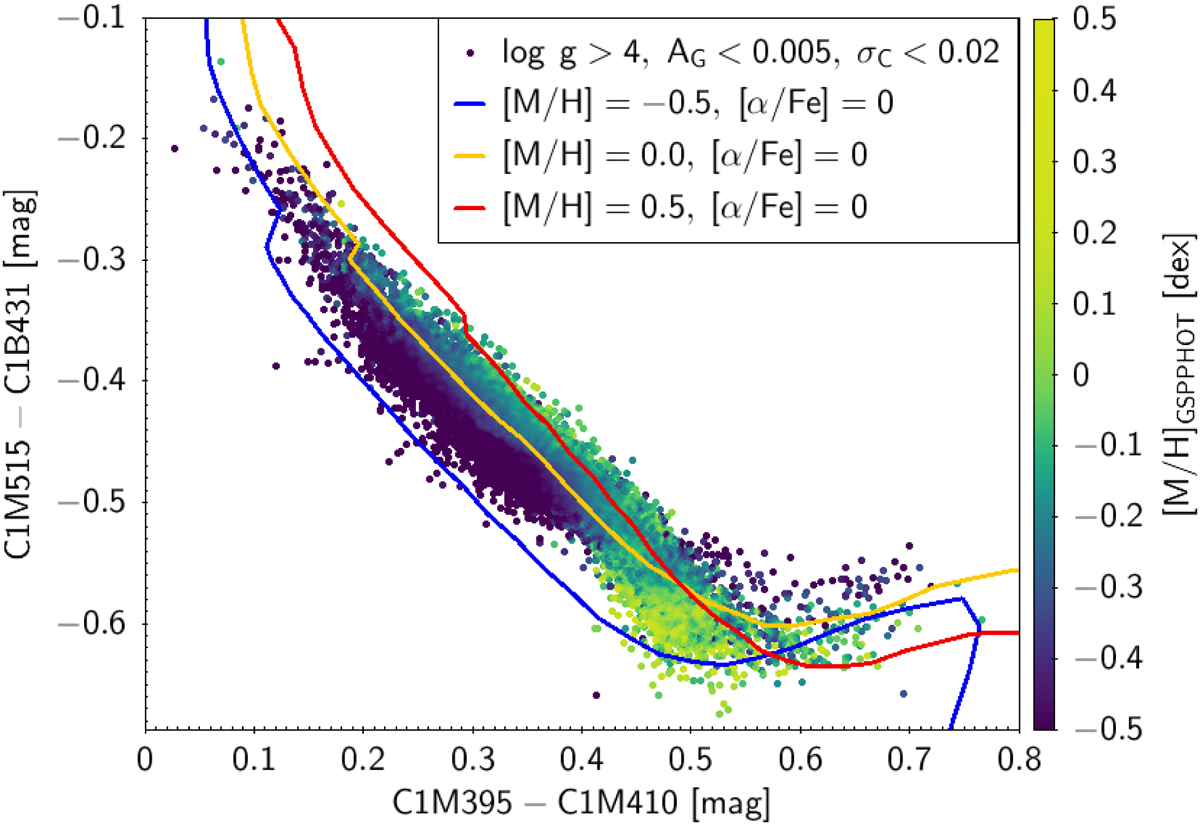
C1 colour–colour diagram sensitive to global metallicity for a set of field stars. Lines in the figure represent the simulated photometry from BTSettl SEDs, plotting only solar alpha abundance ([α/Fe] = 0) for log g = 4. Dots represent the synthetic photometry derived from BP and RP spectra with a colour index showing the DPAC CU8 metallicity derived using the GSP-Phot algorithm (mh_GSP-Phot).
Current usage metrics show cumulative count of Article Views (full-text article views including HTML views, PDF and ePub downloads, according to the available data) and Abstracts Views on Vision4Press platform.
Data correspond to usage on the plateform after 2015. The current usage metrics is available 48-96 hours after online publication and is updated daily on week days.
Initial download of the metrics may take a while.