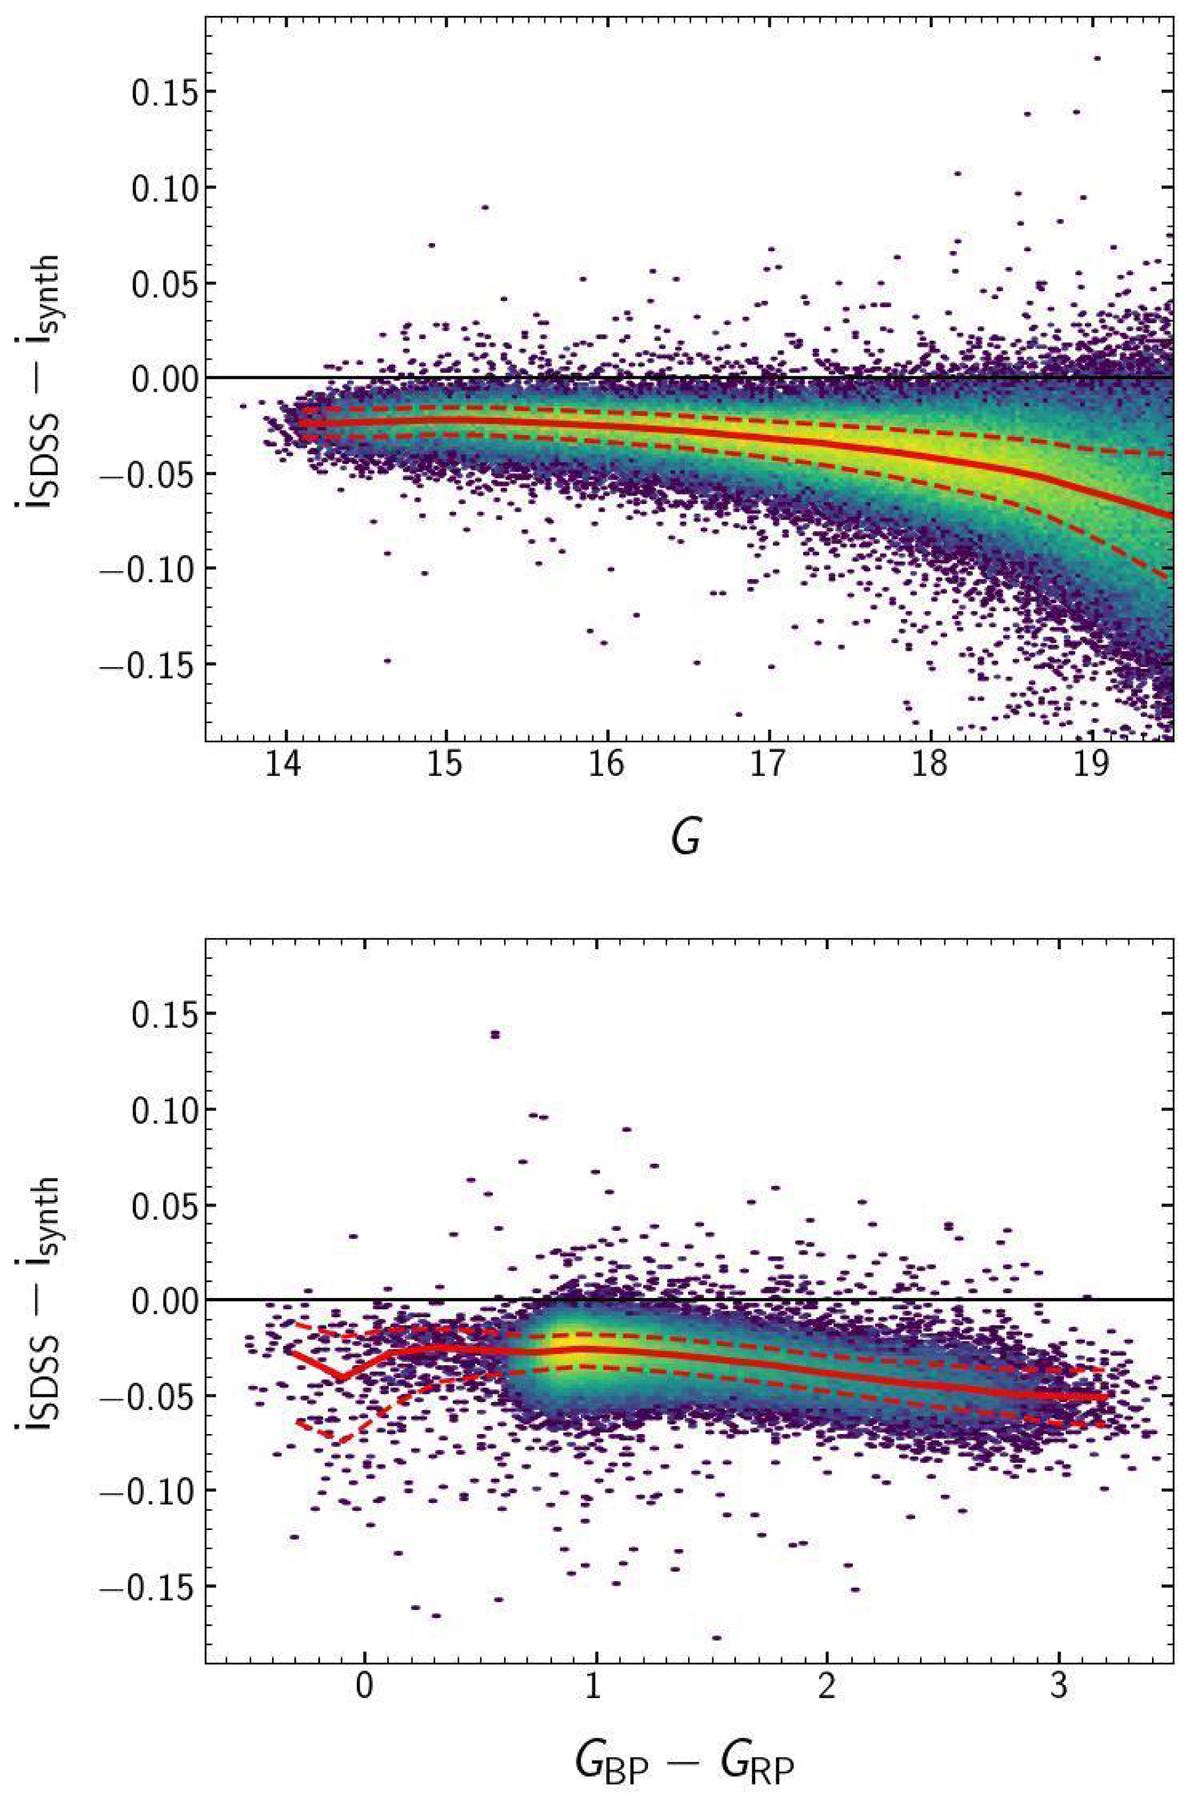
Fig. 3.
Download original image
Residuals between reference and synthetic magnitudes computed through a nominal filter transmission curve (Doi et al. 2010) for a set of standard stars plotted as a function of G magnitudes (top) and GBP − GRP colour (bottom). The red continuous curves represent a smoothed median line of the data, while the dashed curves trace the 16th and 84th percentile of the distribution of residuals.
Current usage metrics show cumulative count of Article Views (full-text article views including HTML views, PDF and ePub downloads, according to the available data) and Abstracts Views on Vision4Press platform.
Data correspond to usage on the plateform after 2015. The current usage metrics is available 48-96 hours after online publication and is updated daily on week days.
Initial download of the metrics may take a while.