Fig. 24.
Download original image
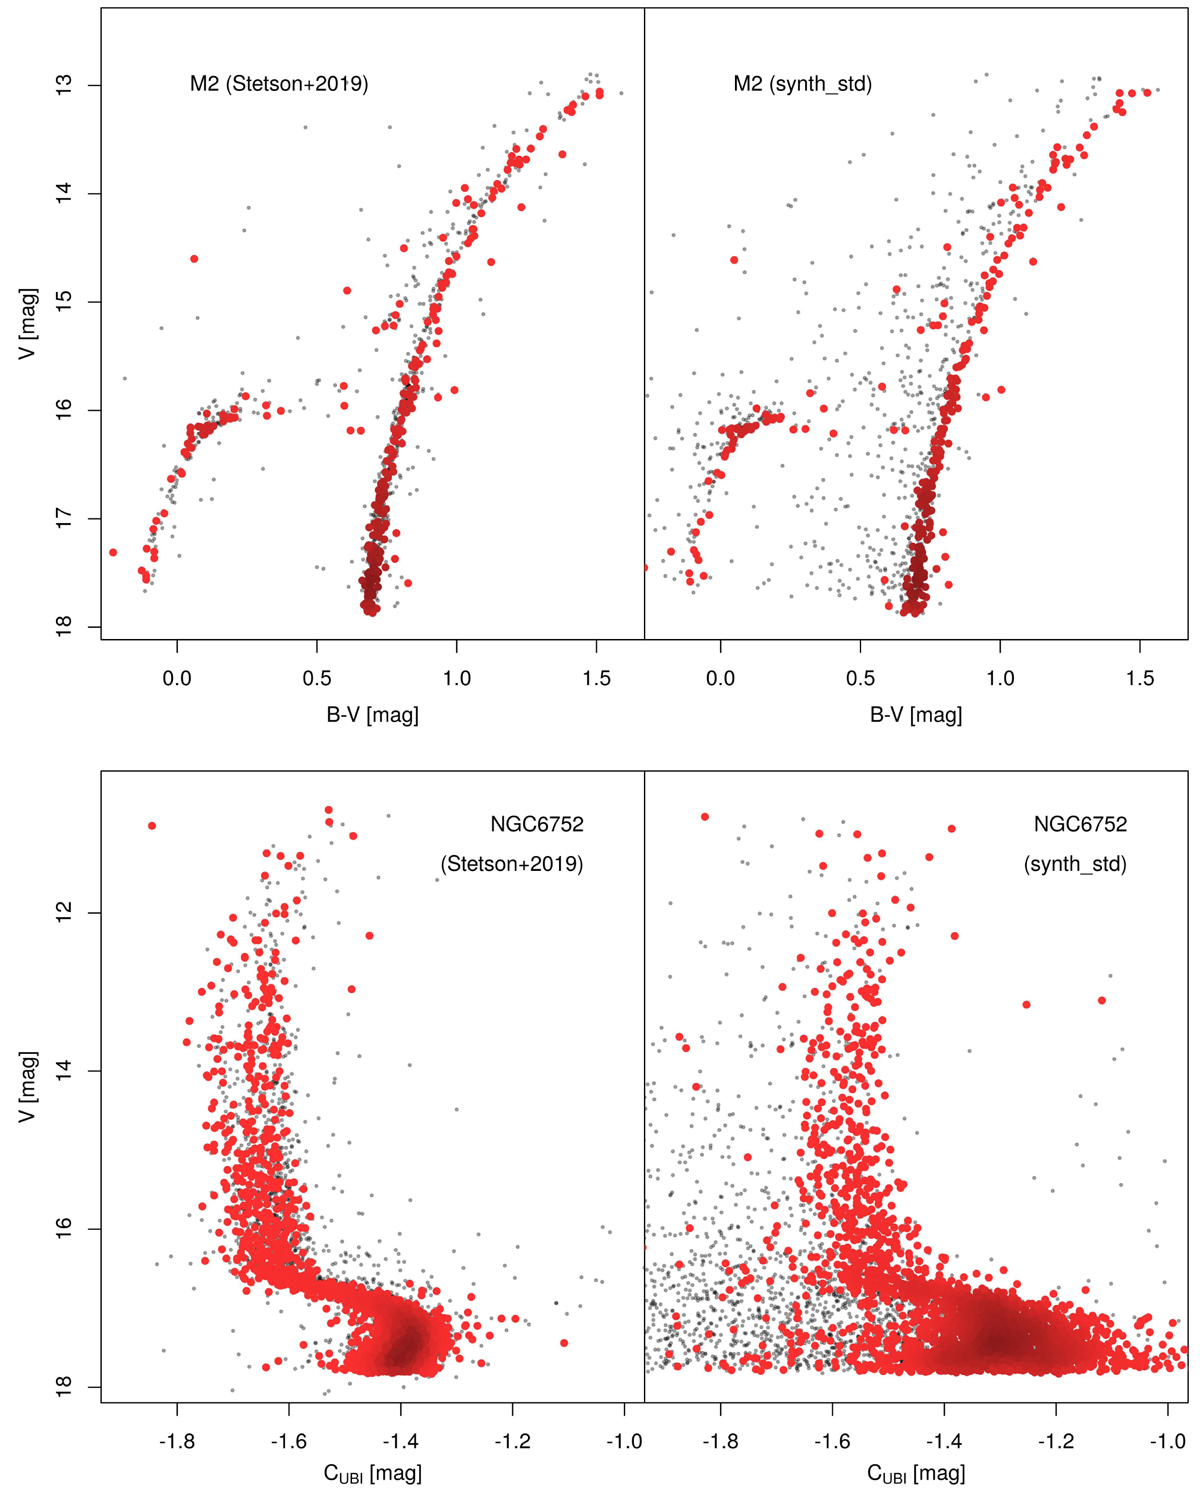
Top panels: ground-based V, B − V photometry of M 2 (left, Stetson et al. 2019) and the corresponding synthetic Gaia photometry (right). The samples selected using the Vasiliev & Baumgardt (2021) criteria are plotted in grey, while the ones further selected with the criteria described in Sect. 5.1 are plotted in red. Bottom panels: similar to the top panels, but for the case of the V, CUBI CMDs of NGC 6752.
Current usage metrics show cumulative count of Article Views (full-text article views including HTML views, PDF and ePub downloads, according to the available data) and Abstracts Views on Vision4Press platform.
Data correspond to usage on the plateform after 2015. The current usage metrics is available 48-96 hours after online publication and is updated daily on week days.
Initial download of the metrics may take a while.