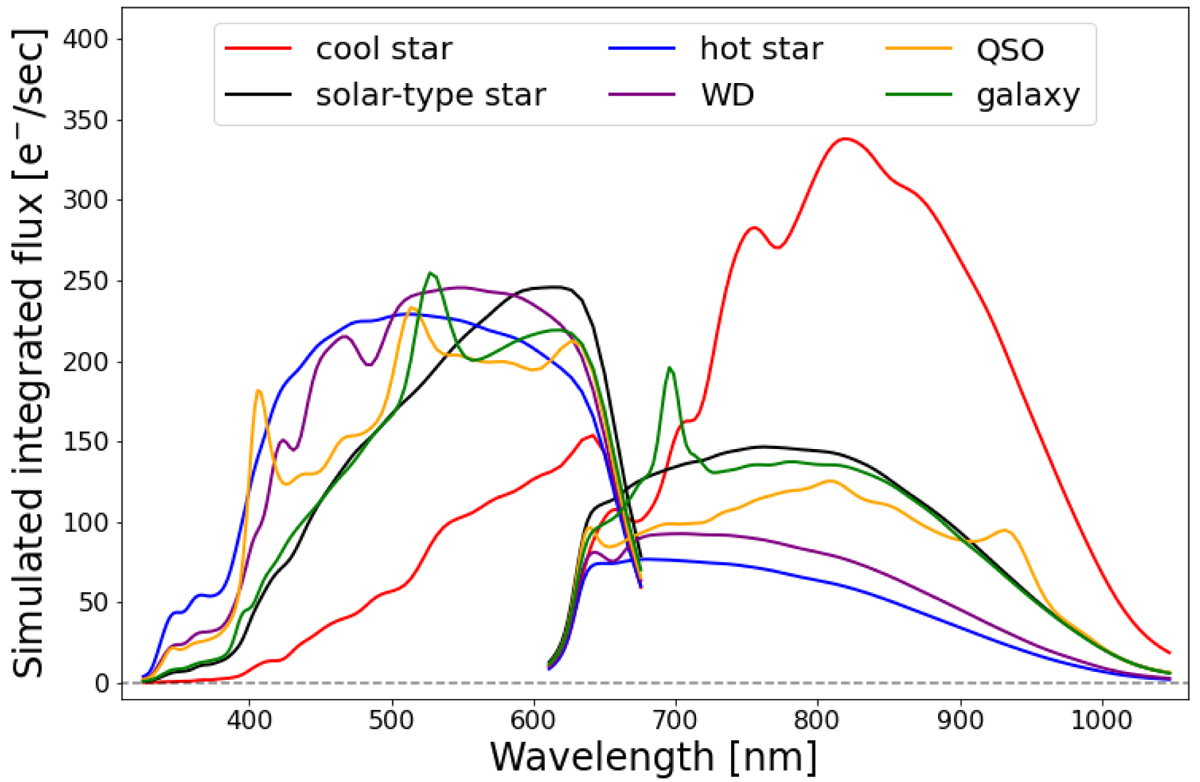
Fig. 9.
Download original image
Examples of BP/RP simulations of different types of sources. All sources are simulated at G = 15. Red and black lines show spectra from the MARCS library with Teff = 3500 and 6000 K. Blue: OB spectrum with Teff = 30 000 K. Purple: WDA spectrum with Teff = 15 000 K and log g = 8.0. Orange and green: SDSS QSO and an SDSS galaxy, with redshifts of z = 2.3 and 0.06 respectively (randomly selected).
Current usage metrics show cumulative count of Article Views (full-text article views including HTML views, PDF and ePub downloads, according to the available data) and Abstracts Views on Vision4Press platform.
Data correspond to usage on the plateform after 2015. The current usage metrics is available 48-96 hours after online publication and is updated daily on week days.
Initial download of the metrics may take a while.