Open Access
Fig. 5.
Download original image
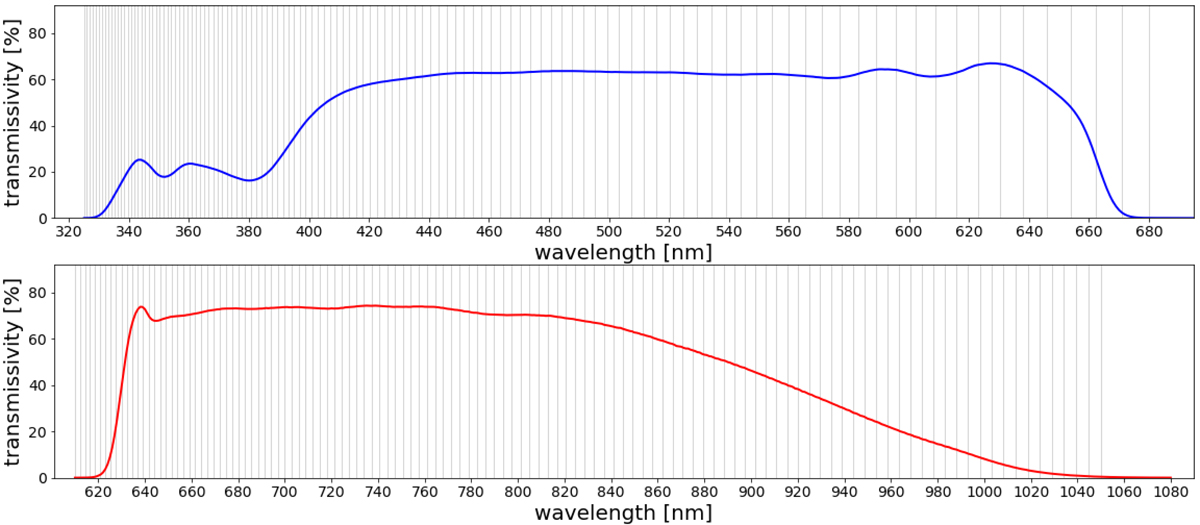
CU8 sampling scheme for BP/RP spectra. Vertical grey lines show the wavelengths of 121 pixel edges defining 120 pixels for BP (top panel) and RP (bottom panel). The blue and red lines show the BP and RP transmission curves from Gaia eDR3, respectively.
Current usage metrics show cumulative count of Article Views (full-text article views including HTML views, PDF and ePub downloads, according to the available data) and Abstracts Views on Vision4Press platform.
Data correspond to usage on the plateform after 2015. The current usage metrics is available 48-96 hours after online publication and is updated daily on week days.
Initial download of the metrics may take a while.