Fig. 4.
Download original image
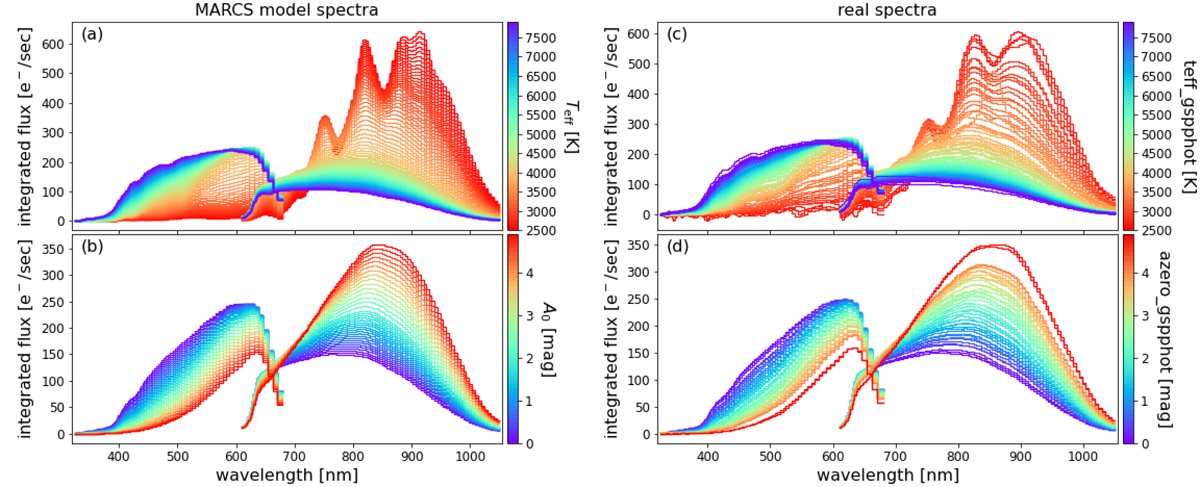
Example BP/RP model spectra (left) and real spectra (right). All BP/RP spectra have been rescaled to an apparent magnitude of G = 15 in order to make their flux levels comparable. Panels (a) and (c) show the variation with Teff, and panels (b) and (d) show the variation with A0. Panels (a) and (b) show synthetic BP/RP spectra based on MARCS models (see Sect. 4.1). Panels (c) and (d) show BP/RP spectra obtained by Gaia where the APs were produced by the GSP-Phot module in the Apsis pipeline. BP spectra approximately cover the wavelength range from 325 nm to 680 nm and RP spectra from 610 nm to 1050 nm; see Fig. 5.
Current usage metrics show cumulative count of Article Views (full-text article views including HTML views, PDF and ePub downloads, according to the available data) and Abstracts Views on Vision4Press platform.
Data correspond to usage on the plateform after 2015. The current usage metrics is available 48-96 hours after online publication and is updated daily on week days.
Initial download of the metrics may take a while.