Fig. A.1.
Download original image
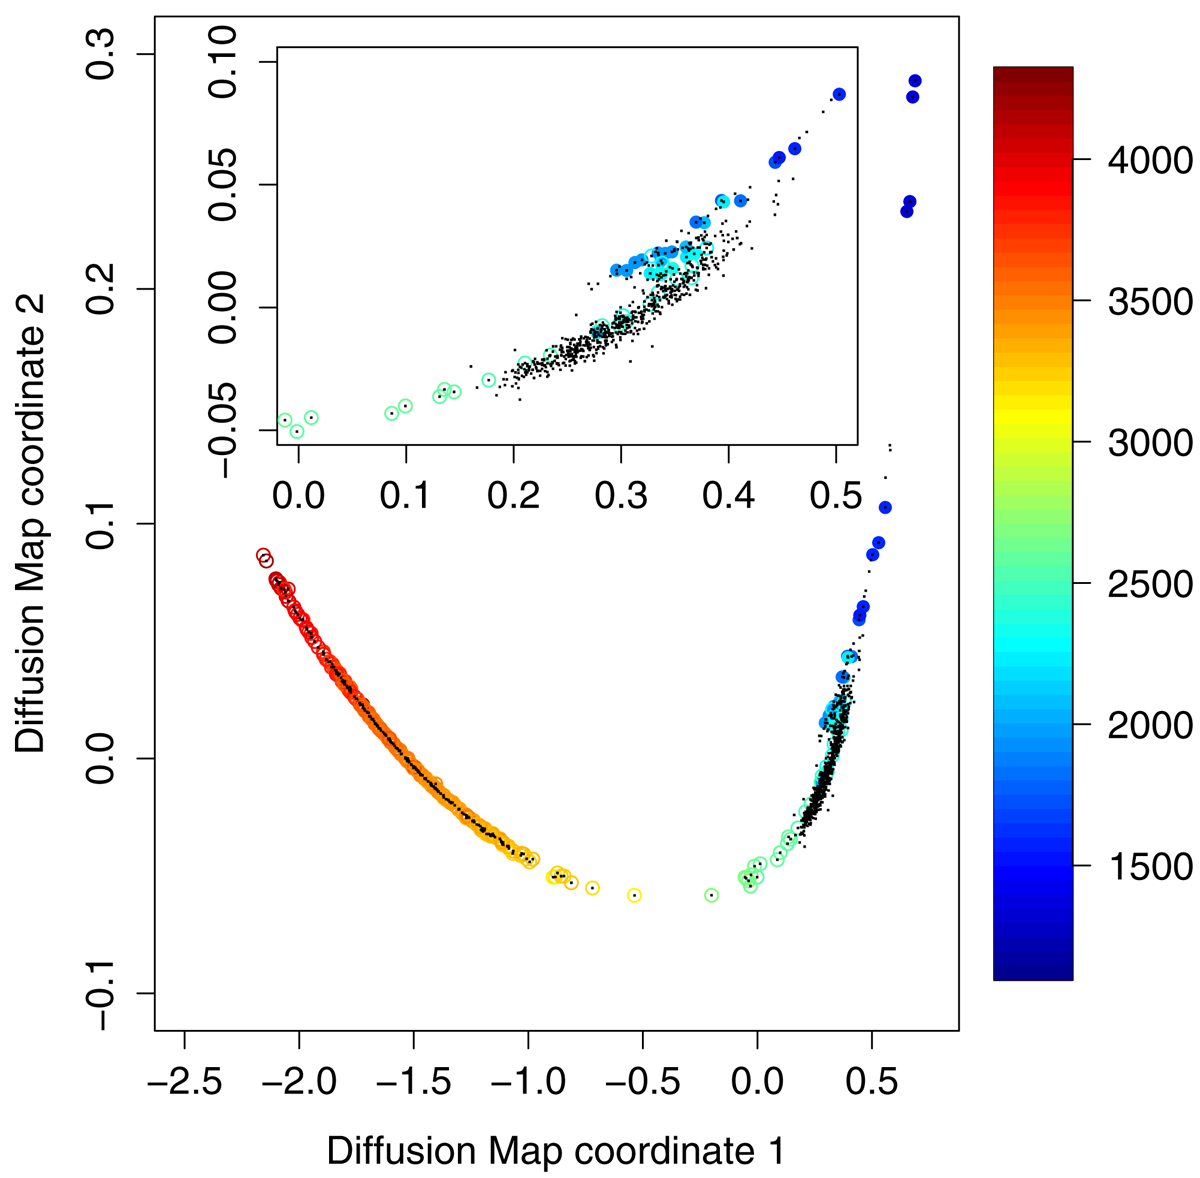
Projection onto the first two diffusion map coordinates of the set of 995 spectra defined in Sect. A.3. The colour code reflects the temperatures assigned according to their spectral types (filled circles) or literature values (empty circles). Black dots represent the entire set of sources used to construct the diffusion map. The inset plot is a zoom of the problematic zone around 2000 K where temperature variations causes only very subtle changes in the RP spectrum.
Current usage metrics show cumulative count of Article Views (full-text article views including HTML views, PDF and ePub downloads, according to the available data) and Abstracts Views on Vision4Press platform.
Data correspond to usage on the plateform after 2015. The current usage metrics is available 48-96 hours after online publication and is updated daily on week days.
Initial download of the metrics may take a while.