Fig. 22.
Download original image
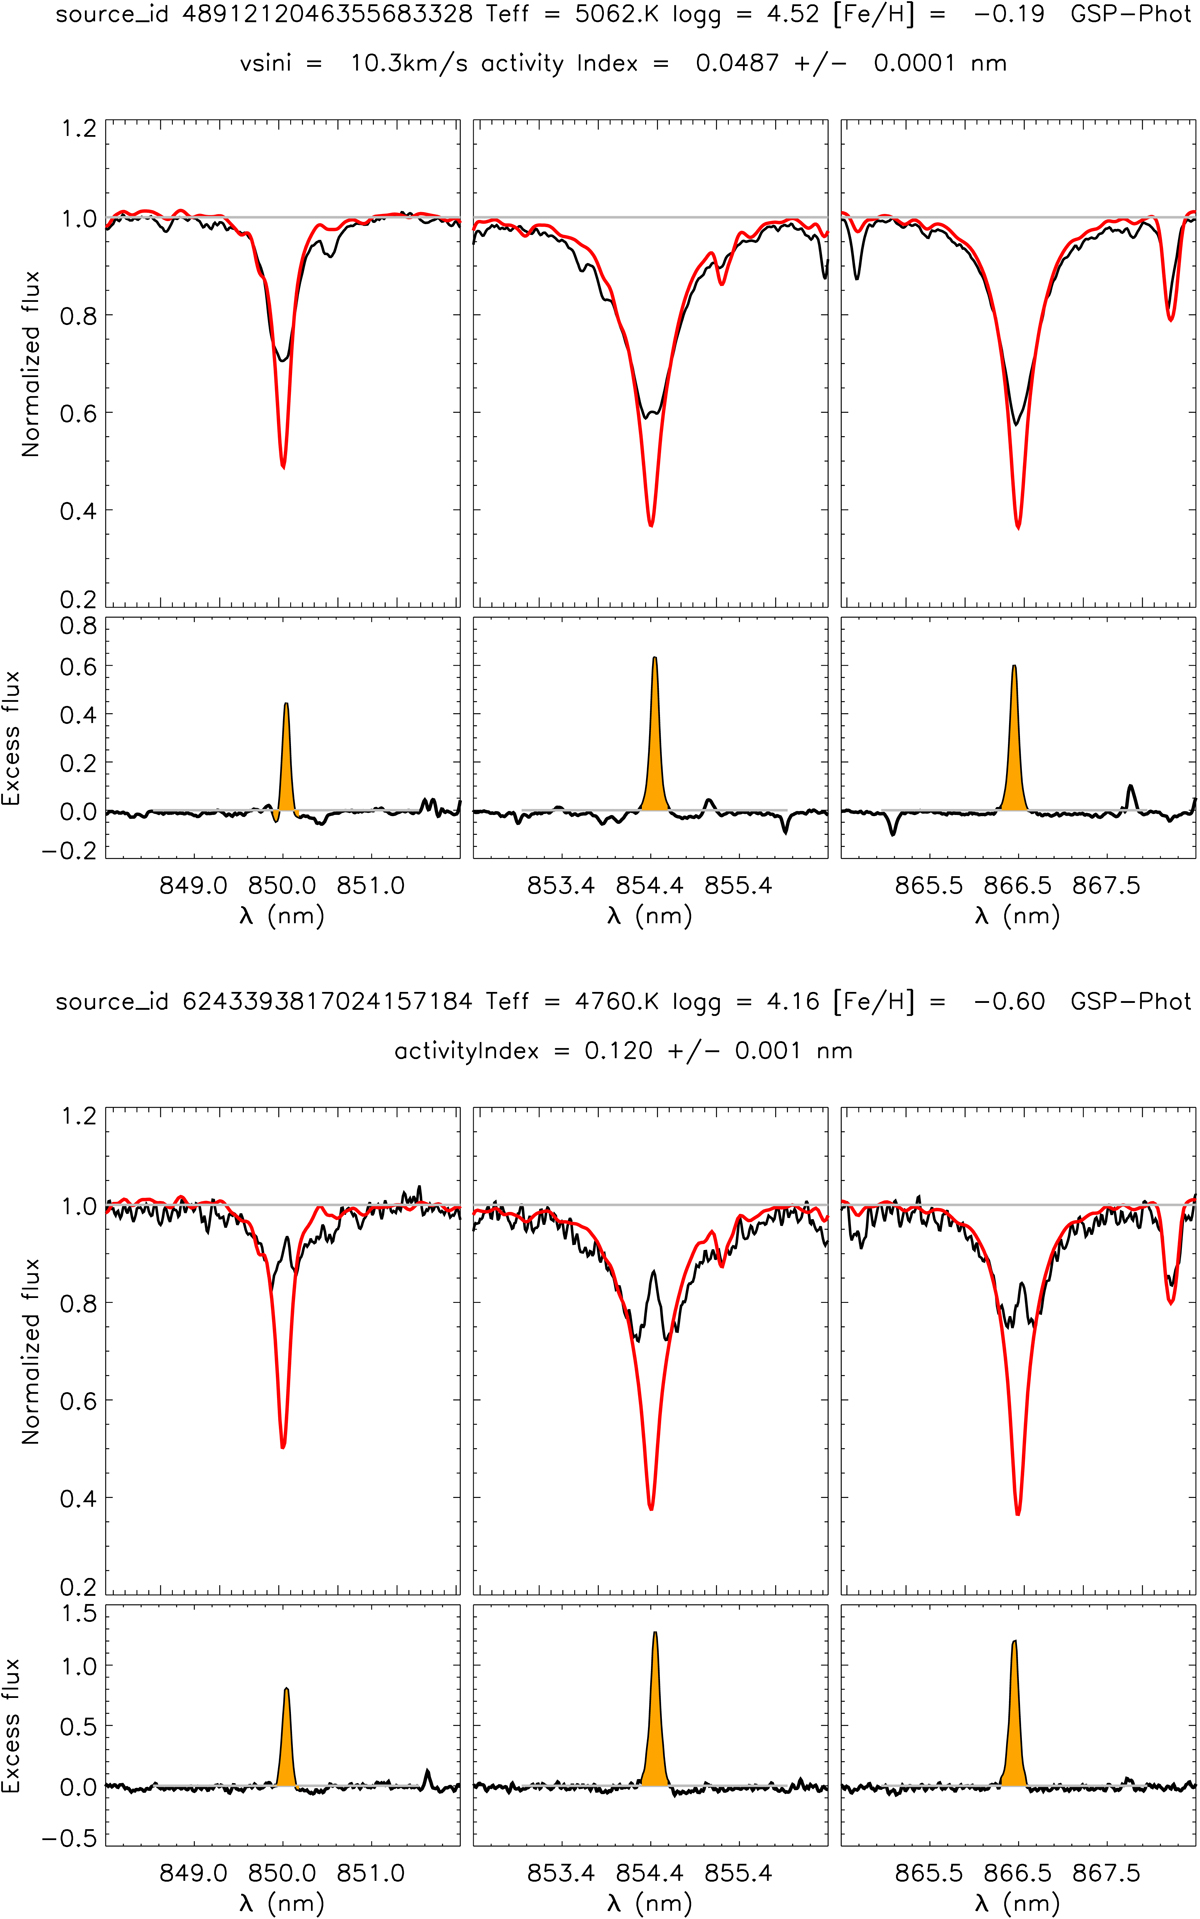
Examples of the activity index derived by the ESP-CS module. Top panel: Ca II IRT RVS spectrum of the chromospherically active star Gaia DR3 4891212046355683328 (HIP 20737) with a measured ![]() = −3.72 from FEROS spectra using the Ca H&K doublet. Bottom panel: RVS spectrum for the T Tauri star Gaia DR3 6243393817024157184 with a mass accretion rate of log Ṁ =−10.51 M⊙ yr−1. The same method is applied to measure these activity indices for both types of excess flux. Black lines are the observed spectra. Red lines are the purely photospheric spectrum template. The orange filled spectral regions are the area over which the integral of the excess flux is evaluated to produce the activity index.
= −3.72 from FEROS spectra using the Ca H&K doublet. Bottom panel: RVS spectrum for the T Tauri star Gaia DR3 6243393817024157184 with a mass accretion rate of log Ṁ =−10.51 M⊙ yr−1. The same method is applied to measure these activity indices for both types of excess flux. Black lines are the observed spectra. Red lines are the purely photospheric spectrum template. The orange filled spectral regions are the area over which the integral of the excess flux is evaluated to produce the activity index.
Current usage metrics show cumulative count of Article Views (full-text article views including HTML views, PDF and ePub downloads, according to the available data) and Abstracts Views on Vision4Press platform.
Data correspond to usage on the plateform after 2015. The current usage metrics is available 48-96 hours after online publication and is updated daily on week days.
Initial download of the metrics may take a while.