Fig. 17.
Download original image
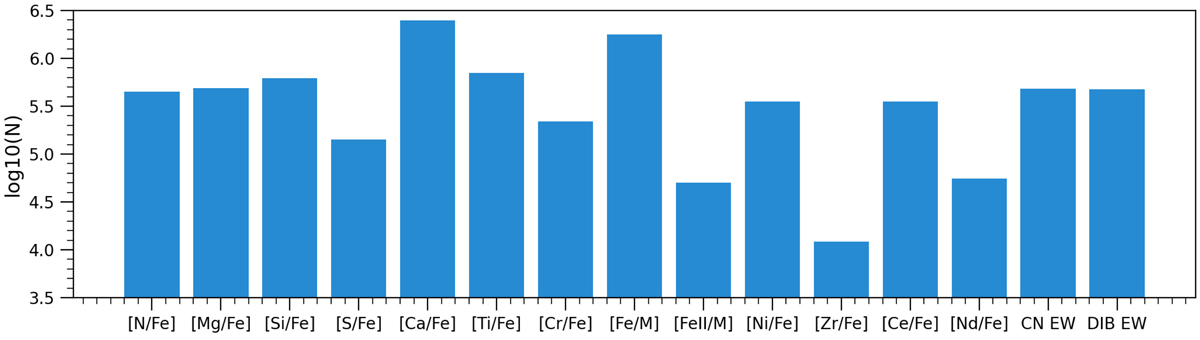
Histogram showing the number of sources for each chemical species with abundances or equivalent widths in Gaia DR3 produced by the GSP-Spec Matisse-Gauguin method, in logarithmic scale. [α/Fe] is derived at the same time as the atmospheric parameters (Teff, log g, [M/H]) and is available for approximately 5 million sources. A quality flag flags_gspspec is provided for the best use of the elemental abundances.
Current usage metrics show cumulative count of Article Views (full-text article views including HTML views, PDF and ePub downloads, according to the available data) and Abstracts Views on Vision4Press platform.
Data correspond to usage on the plateform after 2015. The current usage metrics is available 48-96 hours after online publication and is updated daily on week days.
Initial download of the metrics may take a while.